
Partha User Guide#
Security Research Platform — Complete Operator Guide
Product of CyberLynk LLP · Made in India
Version 0.1.0 · Documentation dated 27 September 2026
About this document#
This is the complete, hands-on documentation for Partha, CyberLynk's native desktop security-testing workbench. It explains every tool and every sub-feature in the product, how to install it on Windows and Linux, and how to drive each feature step by step.
Every screenshot in this guide is a real capture of the running application,
and every walkthrough was performed live against the same intentionally-
vulnerable public test site — http://demo.testfire.net (IBM/HCL "Altoro
Mutual"). All traffic, scan findings, disassembly, token analysis, OAST
callbacks and diffs shown are genuine output produced during that session —
nothing is mocked.
⚖️ Authorized use only. Partha is an offensive/defensive security tool. Use it only against systems you own or are explicitly authorized to test.
demo.testfire.netis published by its owner expressly for security-tool demonstrations, which is why it is used throughout this guide.
How to read this guide. Sections 1-5 cover platforms, installation and the interface. Section 6 is the tool-by-tool reference: what each tool does, its screenshots (the initial UI and a real activity against the test site) and numbered steps. Section 7 covers the cross-cutting UI (command palette, themes, context menu), Section 8 is reporting and Section 9 is the appendix.
Table of contents#
- Introduction
- Supported operating systems
- Installation
- First launch, licensing & the proxy CA
- The interface at a glance
- Feature reference — every tool & sub-feature
- 6.1 Dashboard · 6.2 Target · 6.3 Proxy · 6.4 Scanner · 6.5 Content Discovery · 6.6 Repeater · 6.7 Intruder · 6.8 API Security · 6.9 Sequencer · 6.10 Comparer · 6.11 Decoder · 6.12 Logger · 6.13 Organizer · 6.14 Sessions · 6.15 Authorization · 6.16 Extender · 6.17 Browser · 6.18 DOM Invader · 6.19 Clickbandit · 6.20 Reverse Engineering · 6.21 Binary Analysis · 6.22 Collaborator · 6.23 Settings
- Cross-cutting UI
- Reporting
- Appendix
1. Introduction#
Partha is a single native desktop application that bundles a full web-application security-testing suite plus binary reverse-engineering, comparable in scope to a professional web-security workbench. It runs completely offline - nothing leaves your machine except the traffic you deliberately send to your targets (and, optionally, a single upload to the decompiler service described in §6.21).
2. Supported operating systems#
Partha is available for Windows and Linux:
| Platform | Installers |
|---|---|
| Windows 10 / 11 (x64) | …_x64-setup.exe and …_x64_en-US.msi |
| Linux (x64) | ….AppImage and …_amd64.deb |
Nothing else needs to be installed. The screenshots in this guide were taken on Windows 11.
3. Installation#
3.1 Install from a released installer (end users)#
- Download the installer for your platform (see §2).
- Windows: run
Partha-Setup…exe(or the.msi). Linux:chmod +x Partha…AppImage && ./Partha…AppImage, orsudo dpkg -i partha…_amd64.deb. - Launch Partha from the Start Menu (Windows) or applications menu (Linux).
4. First launch, licensing & the proxy CA#
4.1 Licensing#
Partha uses an offline, device-bound license (no internet activation). The current status is always visible in Settings → License (see §6.23): licensee, edition, license number, bound device ID, and expiry.
4.2 Install the interception CA (needed for HTTPS)#
To decrypt HTTPS the proxy uses a locally-generated CA created on first run. Open Proxy → Settings (§6.3) and Reinstall certificate / Download it into a trust store you control (or use the built-in testing browser, which trusts it automatically). Install this CA only where you are authorized.
4.3 Point a client at the proxy#
The proxy listens on 127.0.0.1:8080 by default. Configure your browser/tool
to use that HTTP proxy, or use Partha's Browser tool (§6.17), which launches a
pre-configured isolated browser in one click.
5. The interface at a glance#
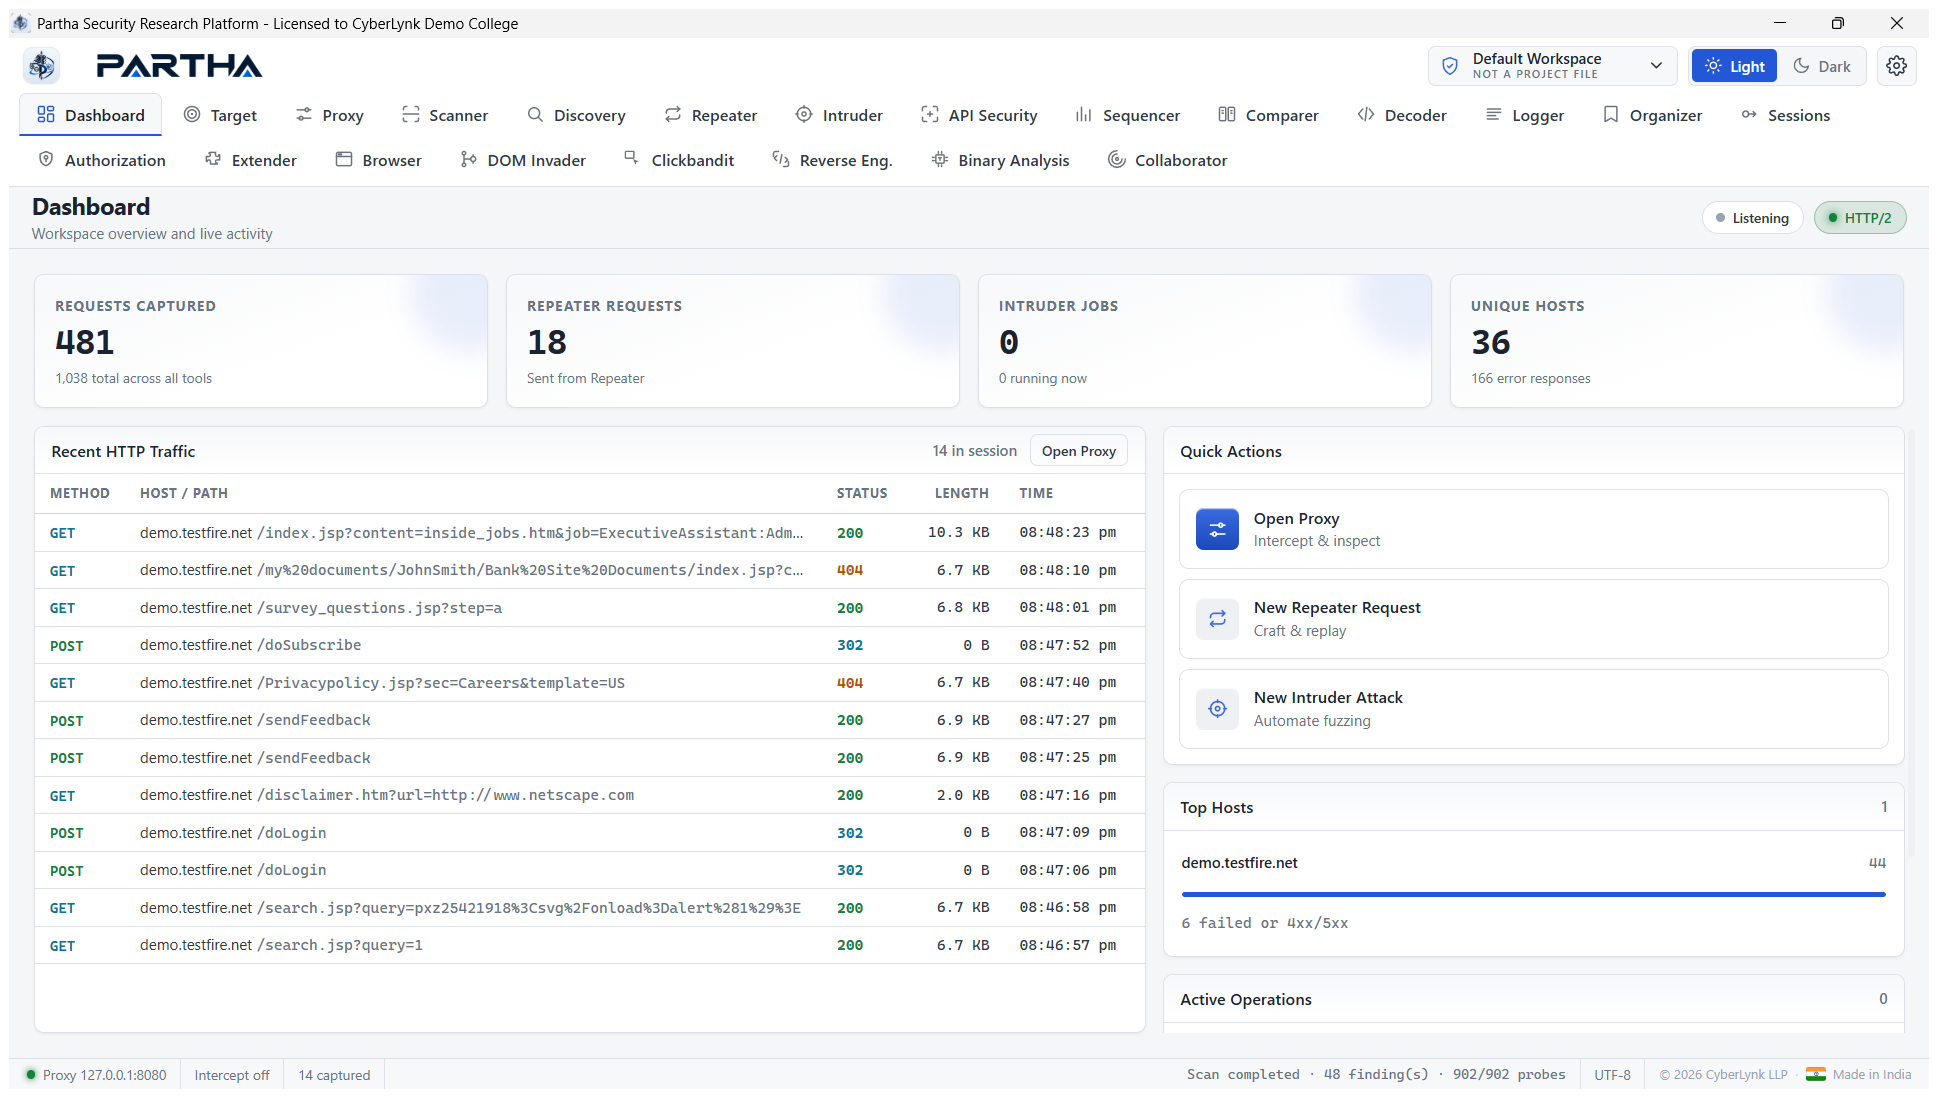
- Top identity bar — the Partha wordmark, the current workspace/project, a Light/Dark theme toggle, and the Settings gear.
- Tab bar (two rows) — every tool. Tabs wrap; they never scroll sideways.
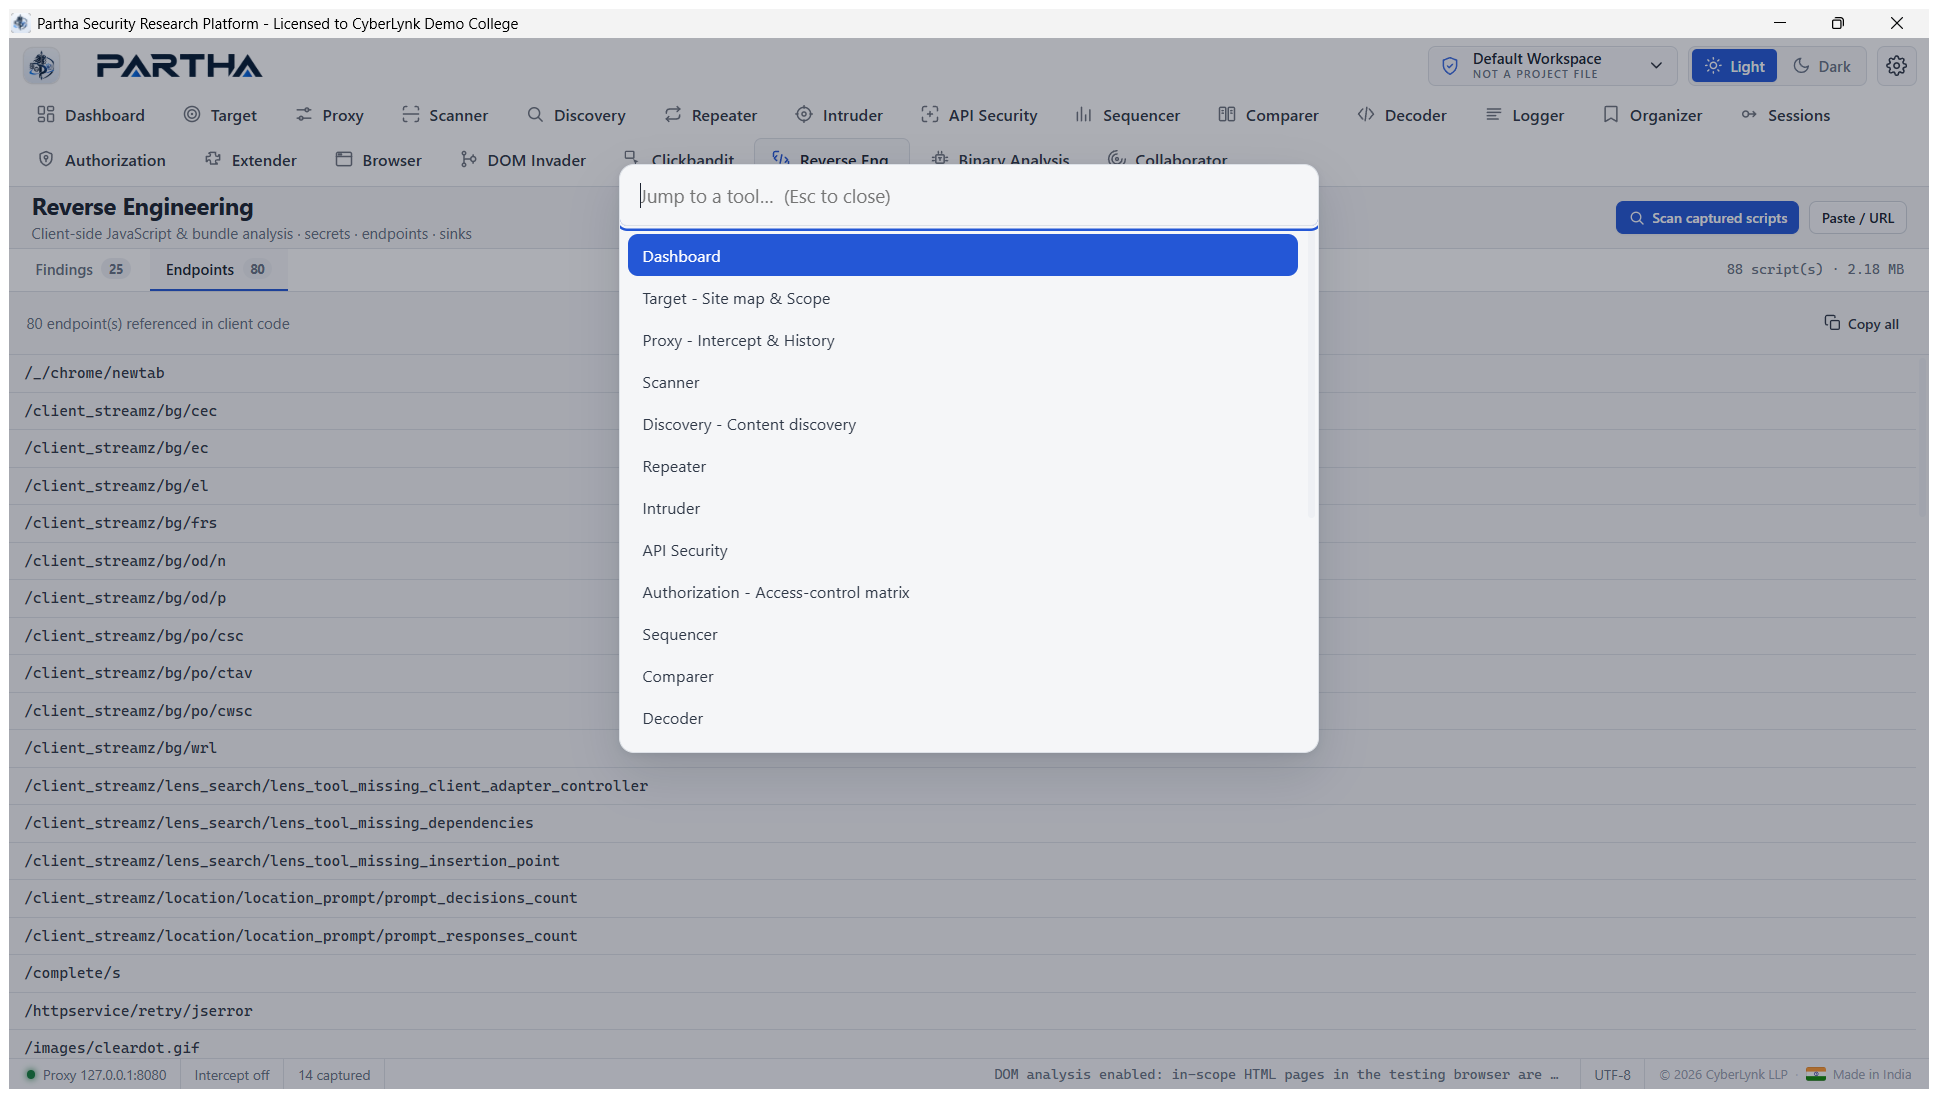
- Command palette —
Ctrl + Kjumps to any tool by name (§7). - Status bar (bottom) — live proxy address, intercept state, capture count, encoding, and running scan status.
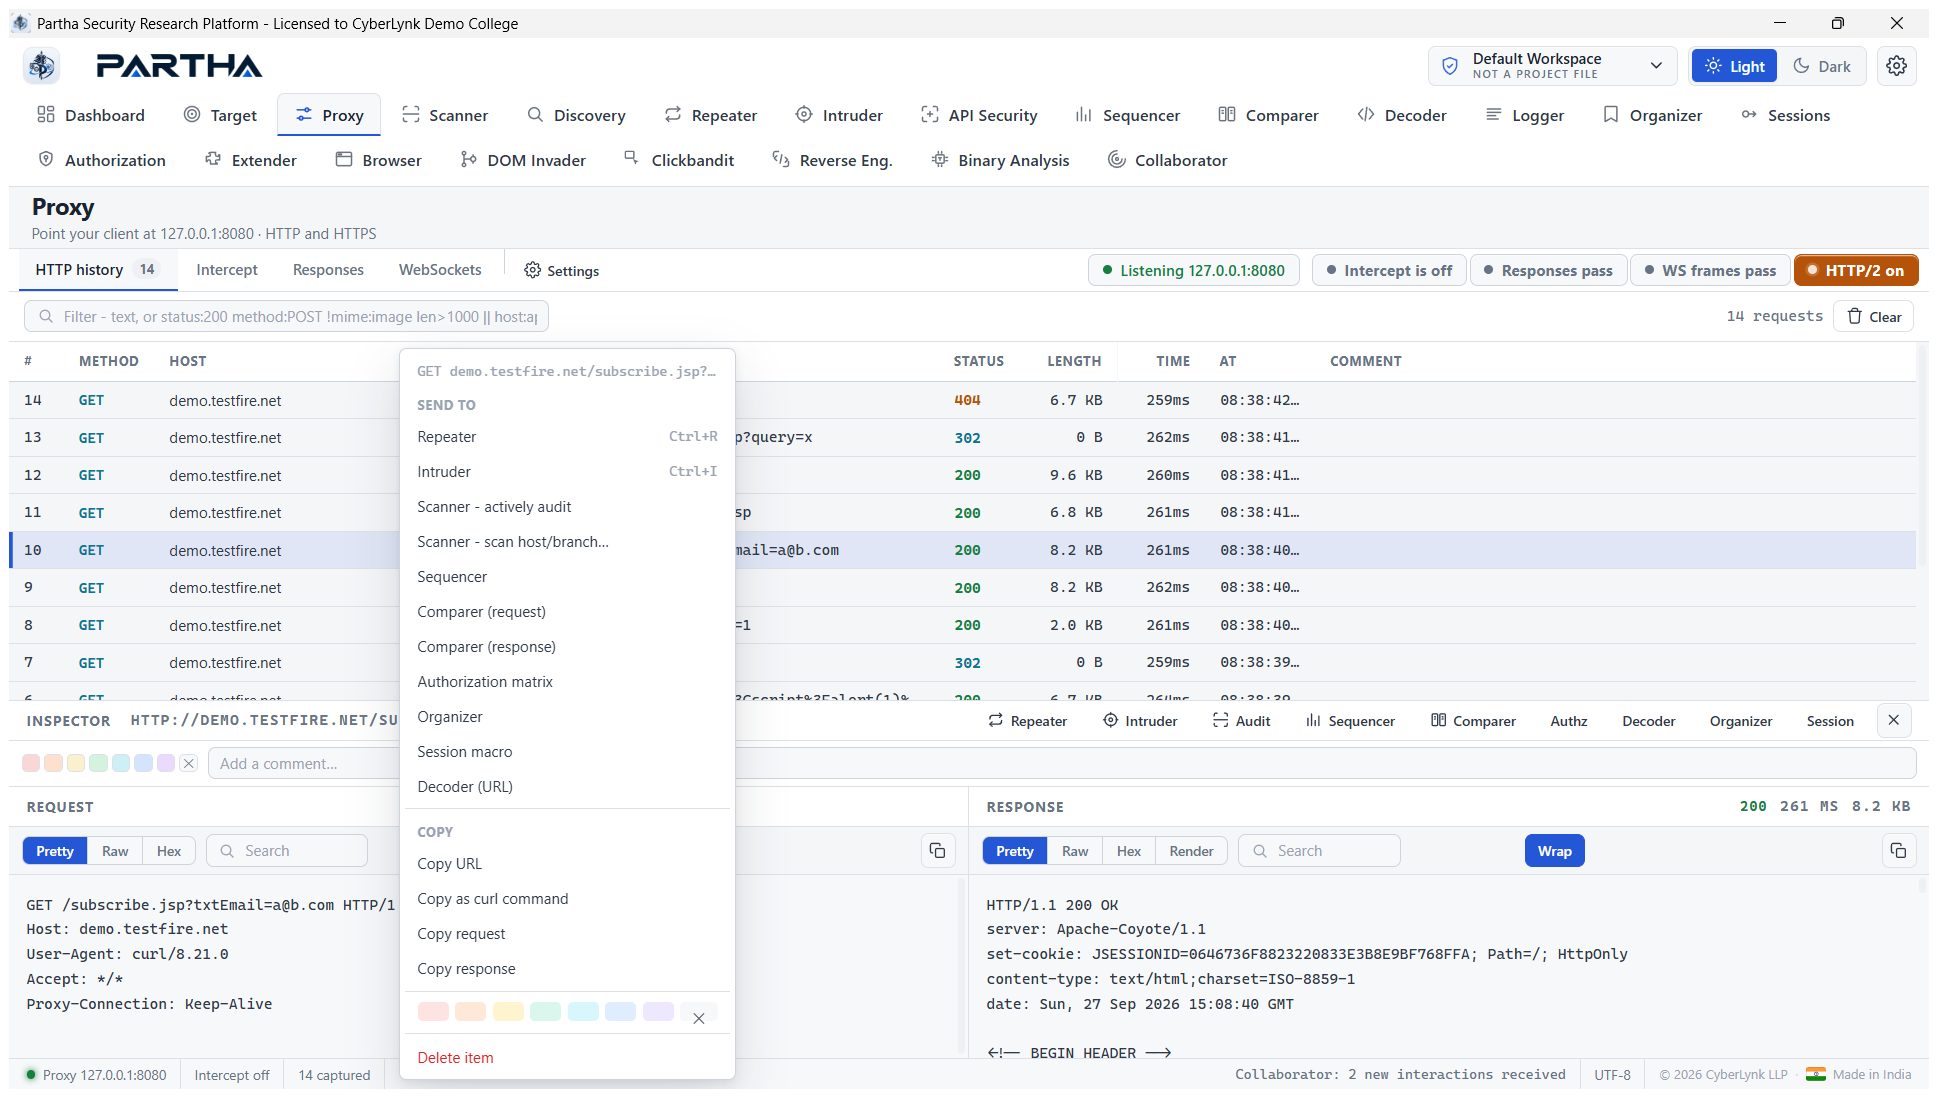
- Right-click any request row or message body for the context menu (§7).
6. Feature reference#
Each subsection shows its screenshots
(initial UI and a real activity on demo.testfire.net), and gives numbered
steps.
6.1 Dashboard#
Live operational overview; every figure is derived from real state.
- Stat tiles — Requests captured (and total across all tools), Repeater requests, Intruder jobs, Unique hosts.
- Recent HTTP Traffic — a live tail of captured exchanges (real
demo.testfire.nettraffic, including the reflected-XSS and fuzzing probes). - Quick actions — Open Proxy, New Repeater Request, New Intruder Attack.
- Top hosts — hosts touched, with request counts; Listening / HTTP/2 pills.
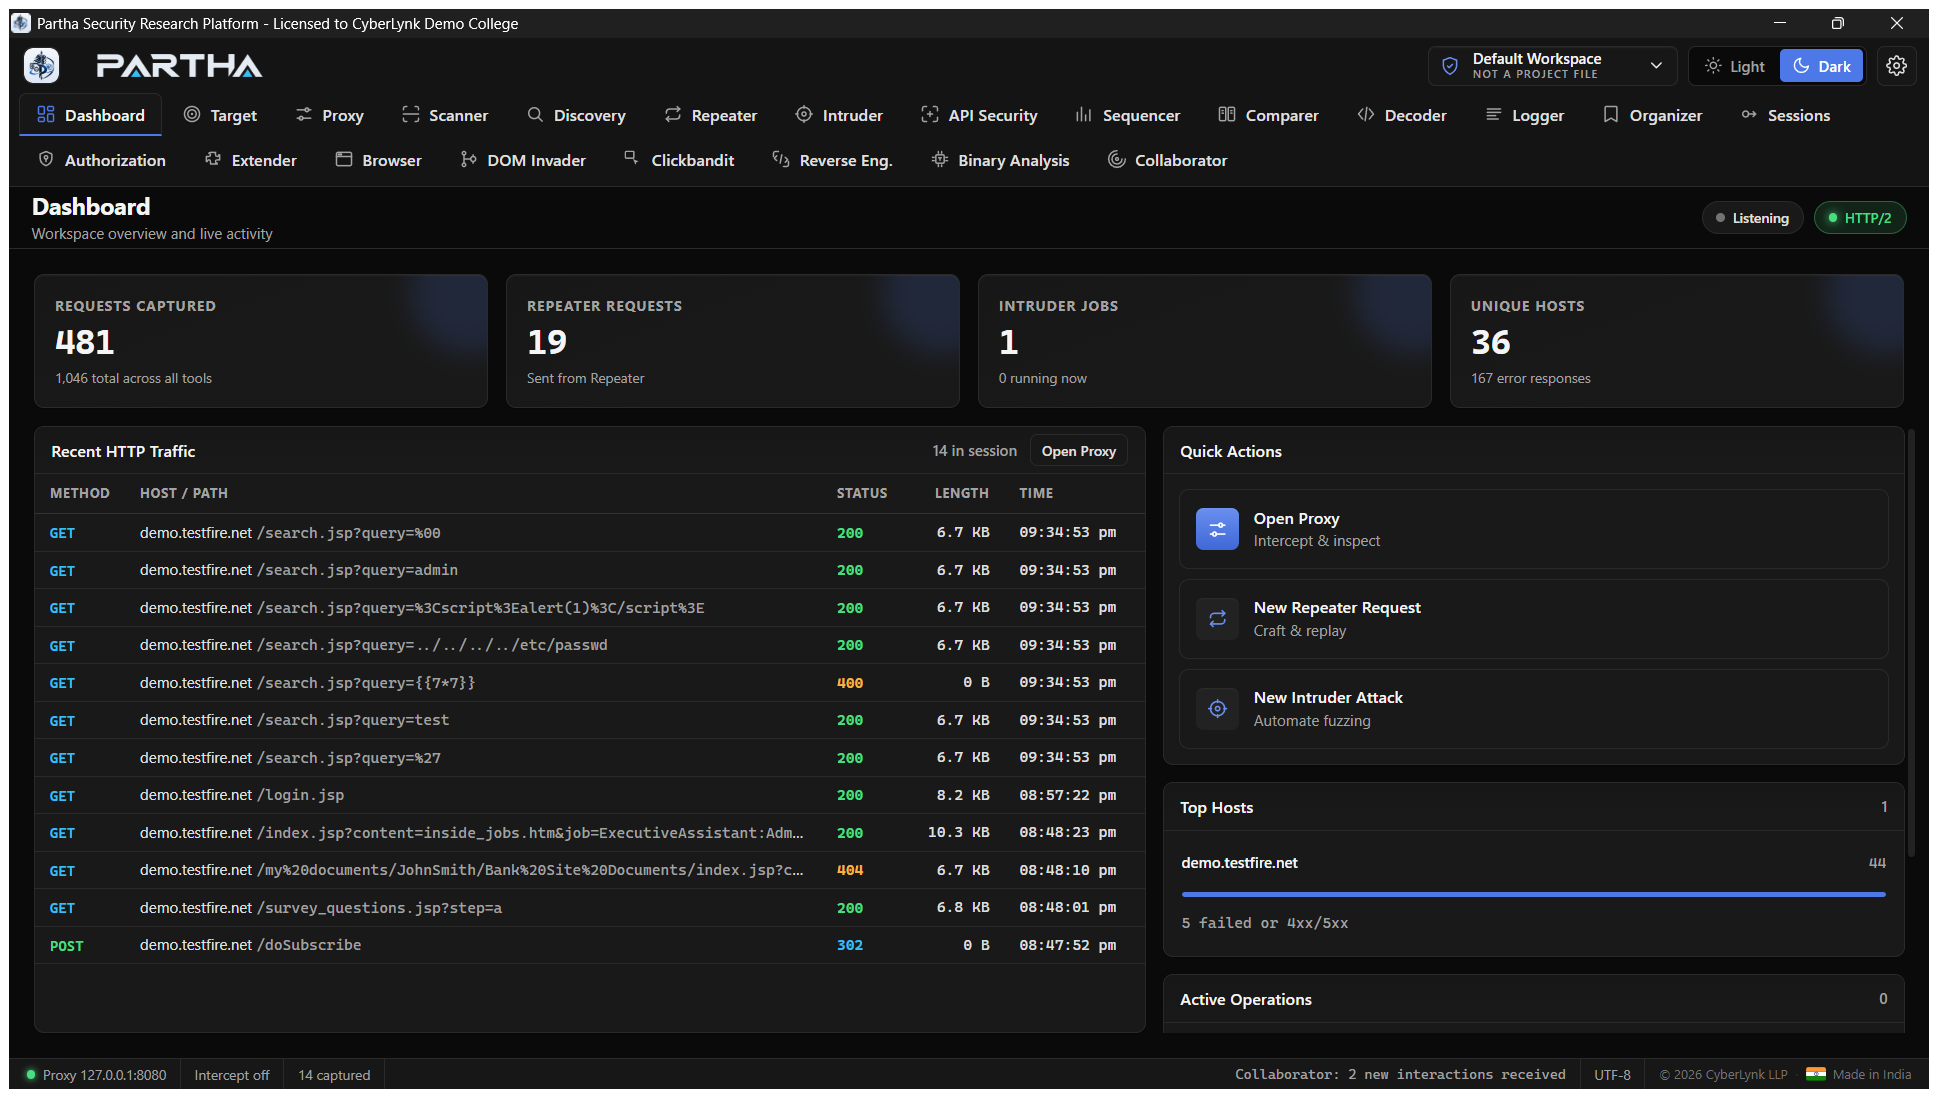
Partha also has a full dark theme (§7):
6.2 Target — site map & scope#
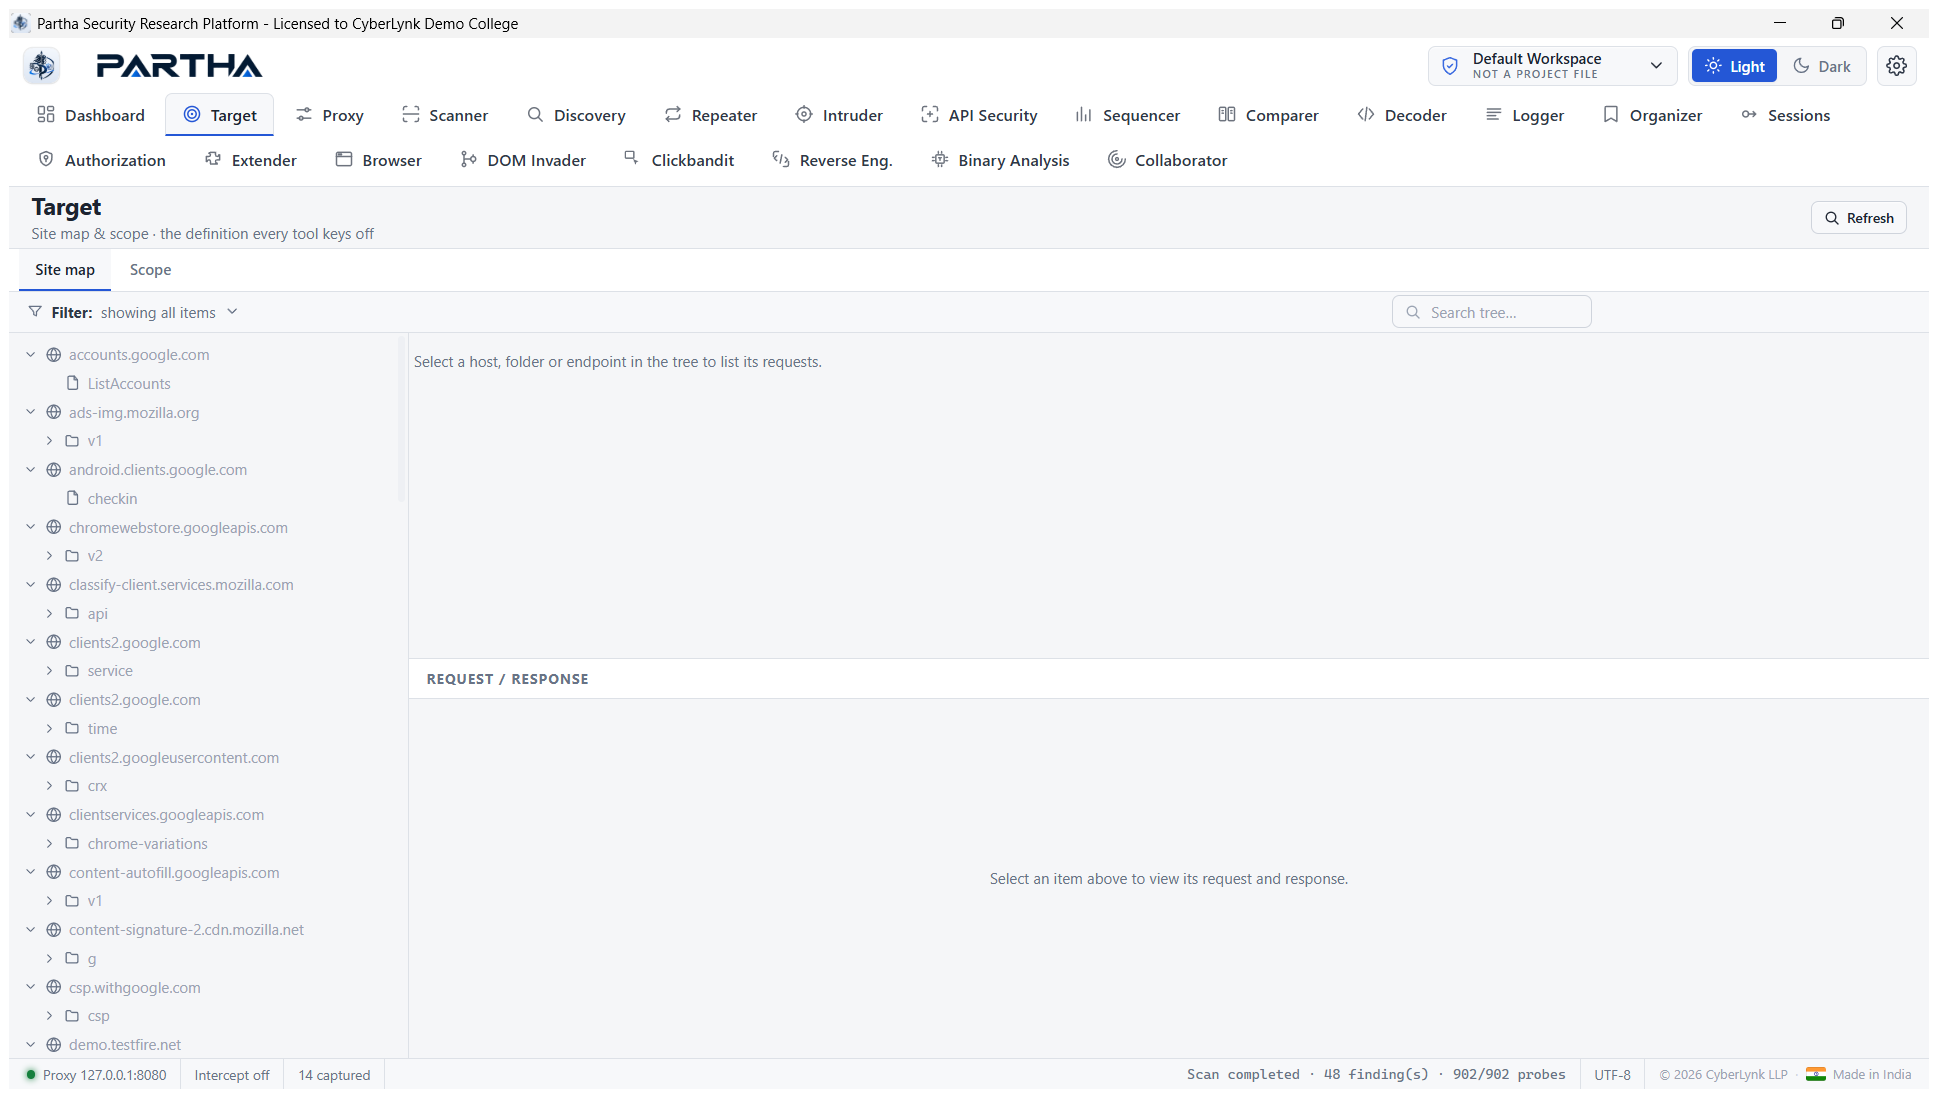
Site map — a per-host tree built automatically from all captured traffic. Select a node to list its requests and inspect request/response.
Scope — the definition every other tool keys off. Define Include/Exclude rules (simple prefix or regex), save/load scope to a file, and optionally gate proxy capture to in-scope traffic only:
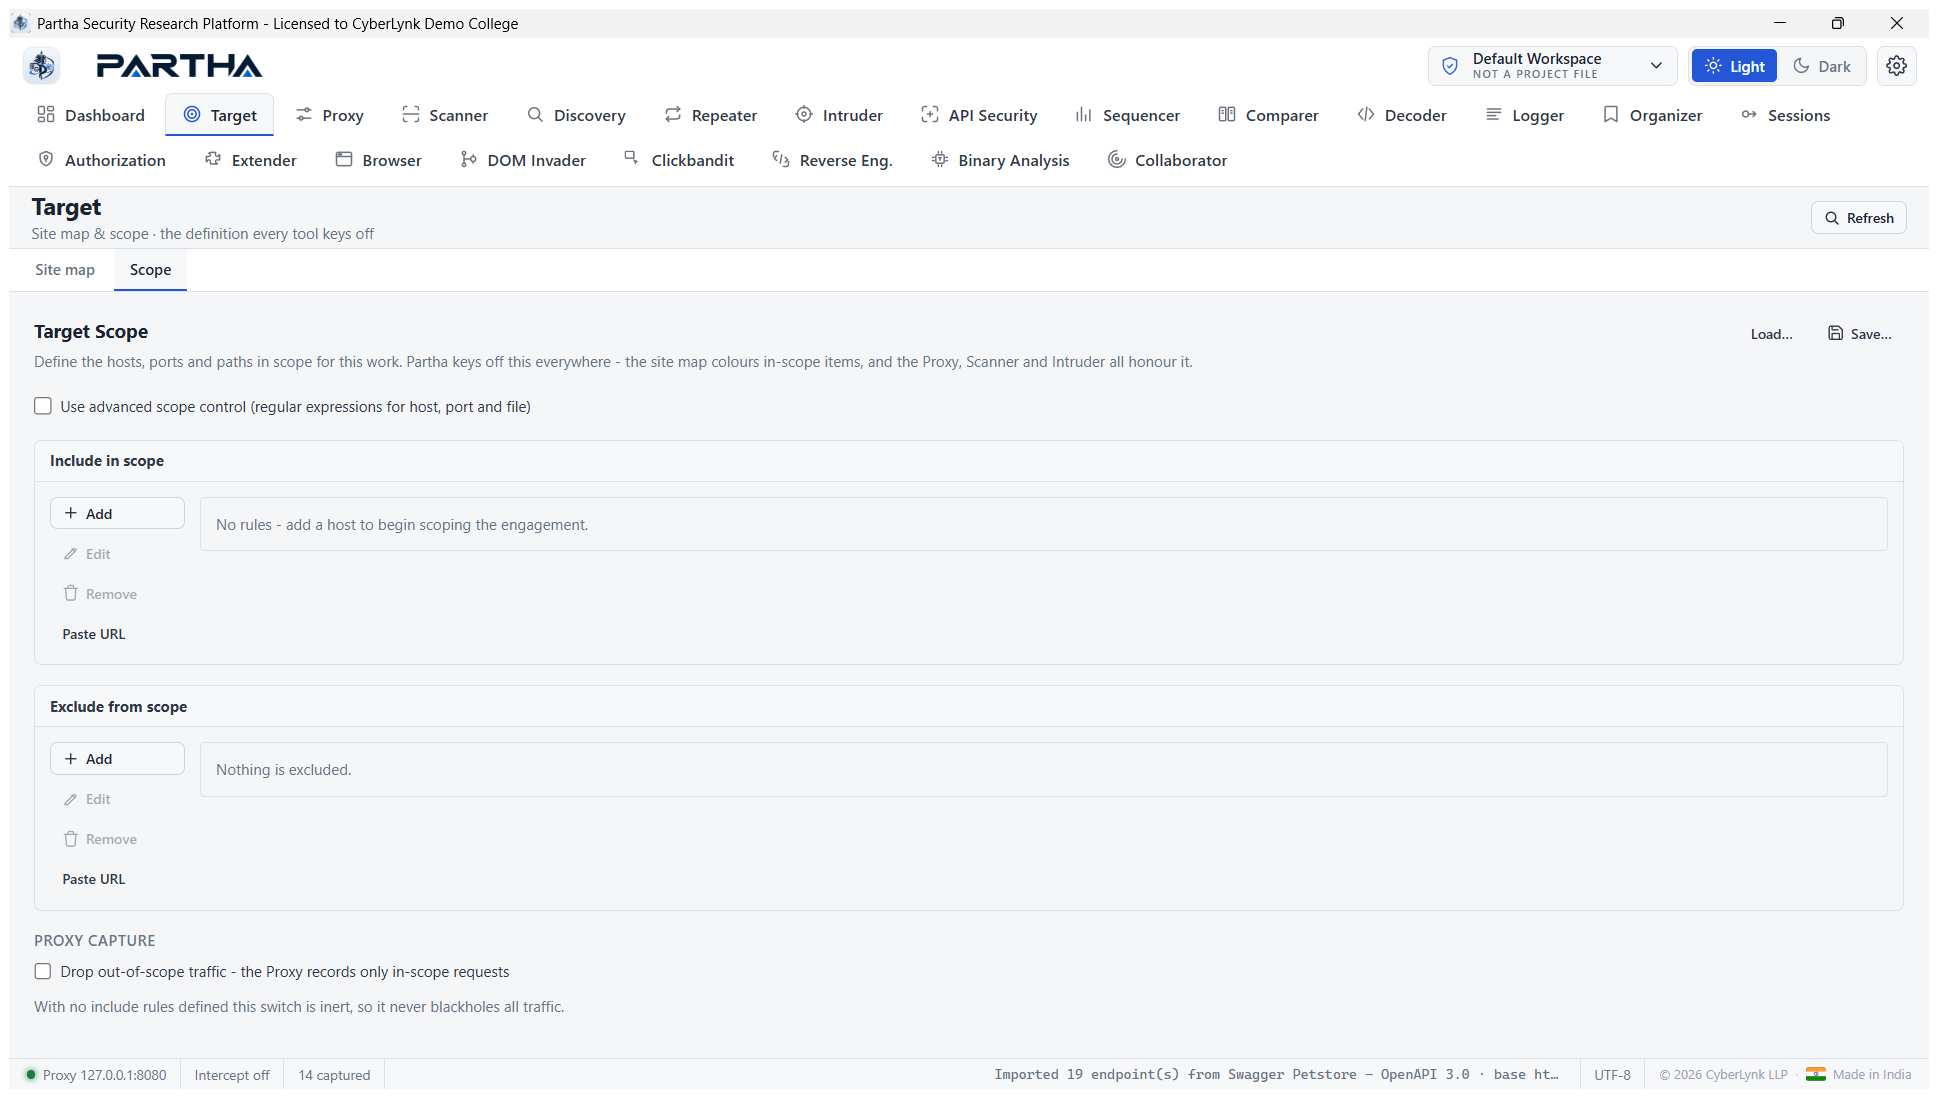
Steps: right-click a site-map host → Add to scope, or open Scope → Add / Paste URL. Toggle Drop out-of-scope traffic to keep the project clean. Scope also drives the Scanner and warns Intruder before out-of-scope attacks.
6.3 Proxy#
Log, intercept and manipulate HTTP, HTTPS and WebSocket traffic, with unrivalled HTTP/2 support and match-and-replace rules.
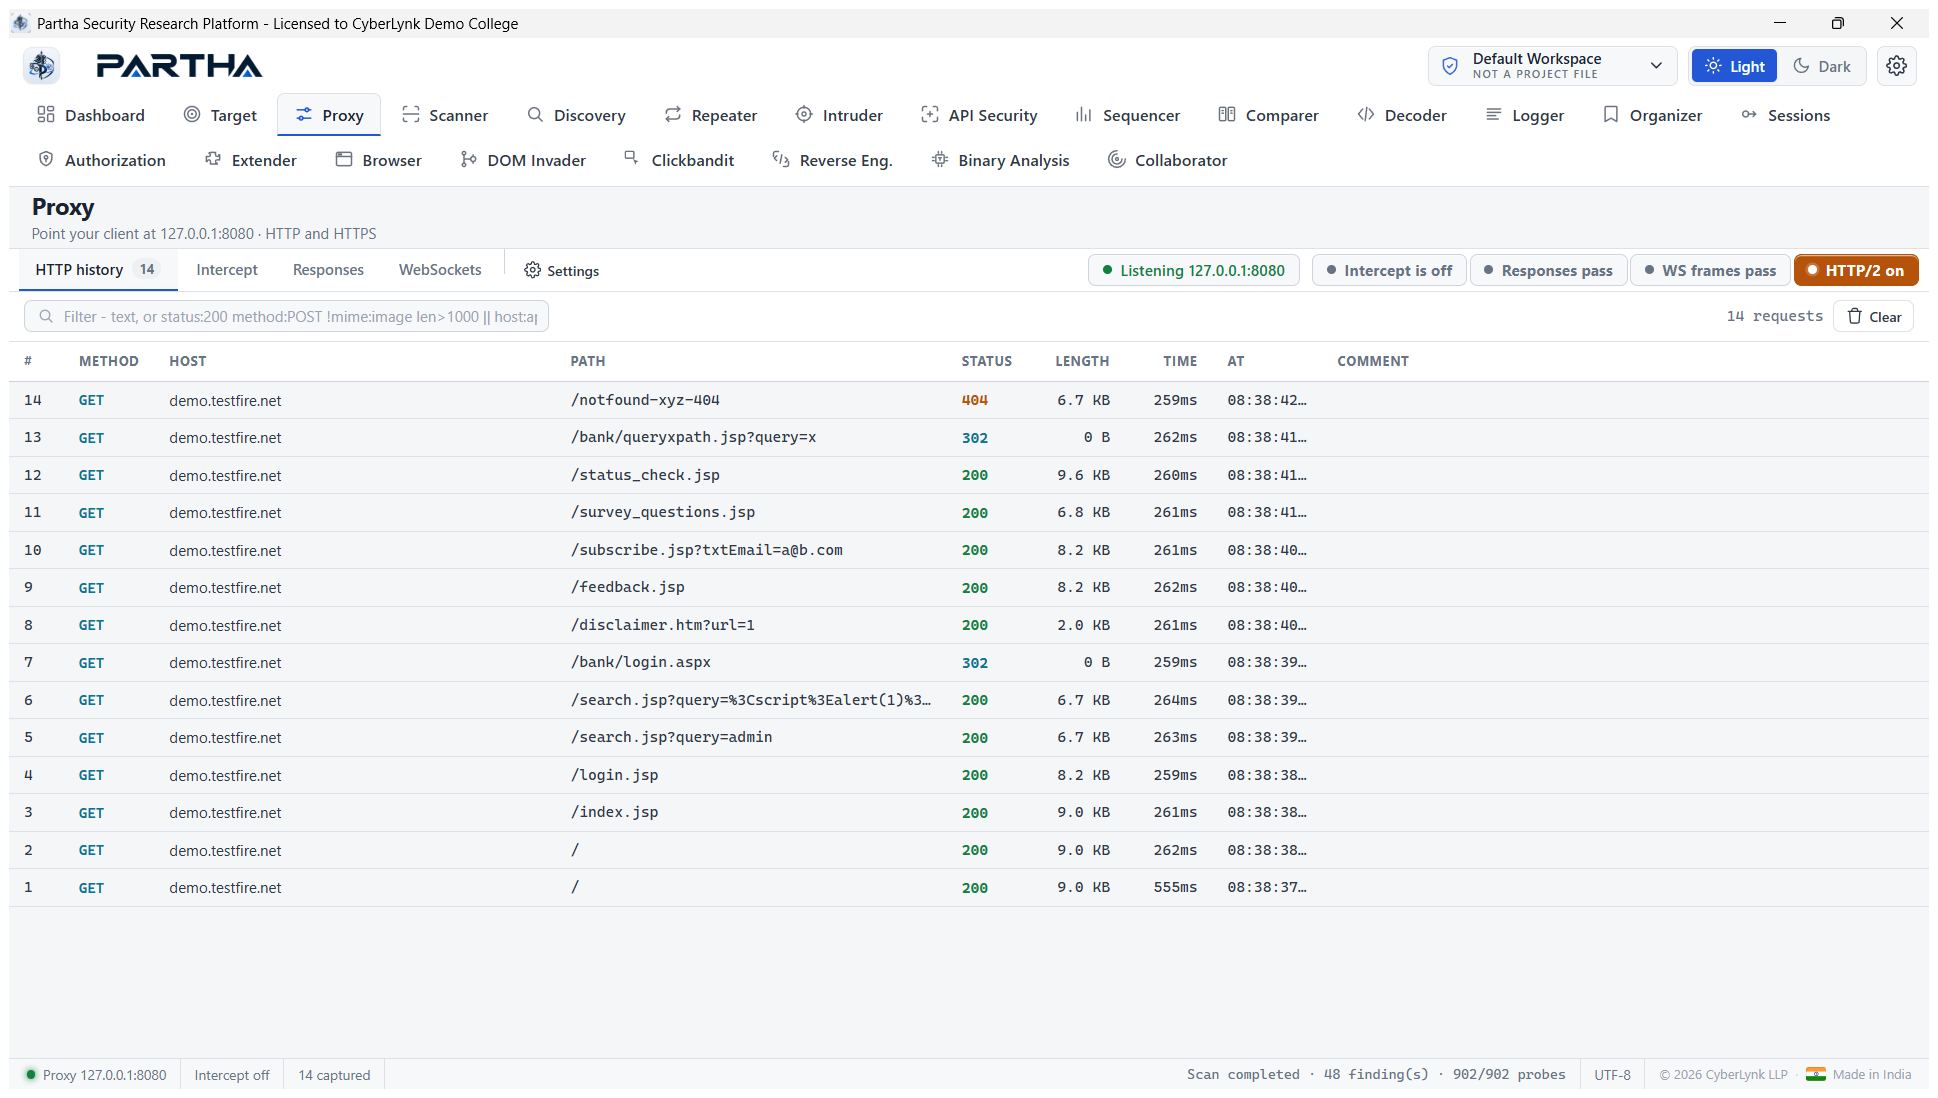
HTTP history — every exchange, with a Bambda-style filter bar. Toolbar
toggles (top-right): Listening 127.0.0.1:8080, Intercept is on/off,
Responses pass, WS frames pass, HTTP/2 on.
Intercept — turn the breakpoint on to hold each request for edit /
Forward / Drop. Below, a real request to /bank/login.aspx?intercepted=demo
is held (1 HELD), editable before release:
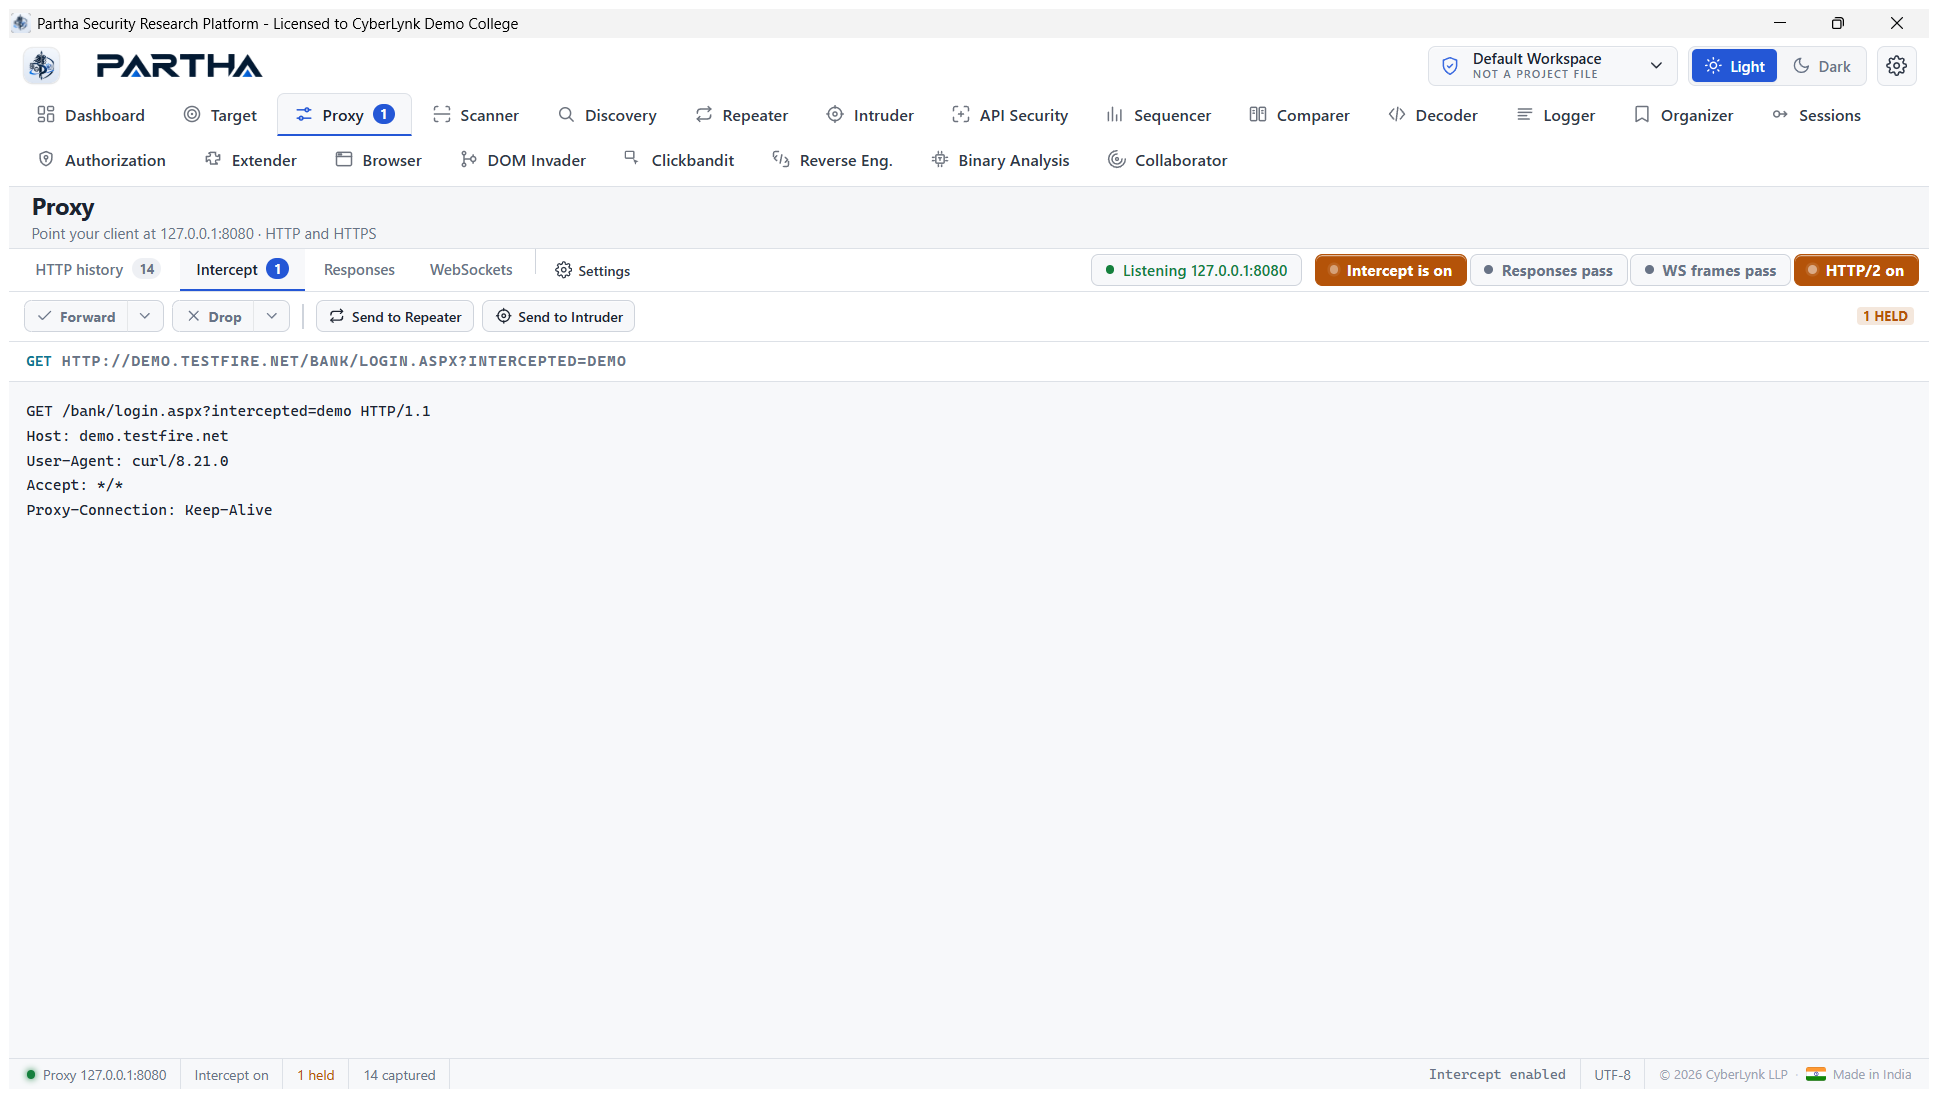
Steps: click Intercept is off to arm it → browse/replay traffic → the request appears on the Intercept tab → edit the raw request if desired → Forward (or Drop, or Send to Repeater/Intruder).
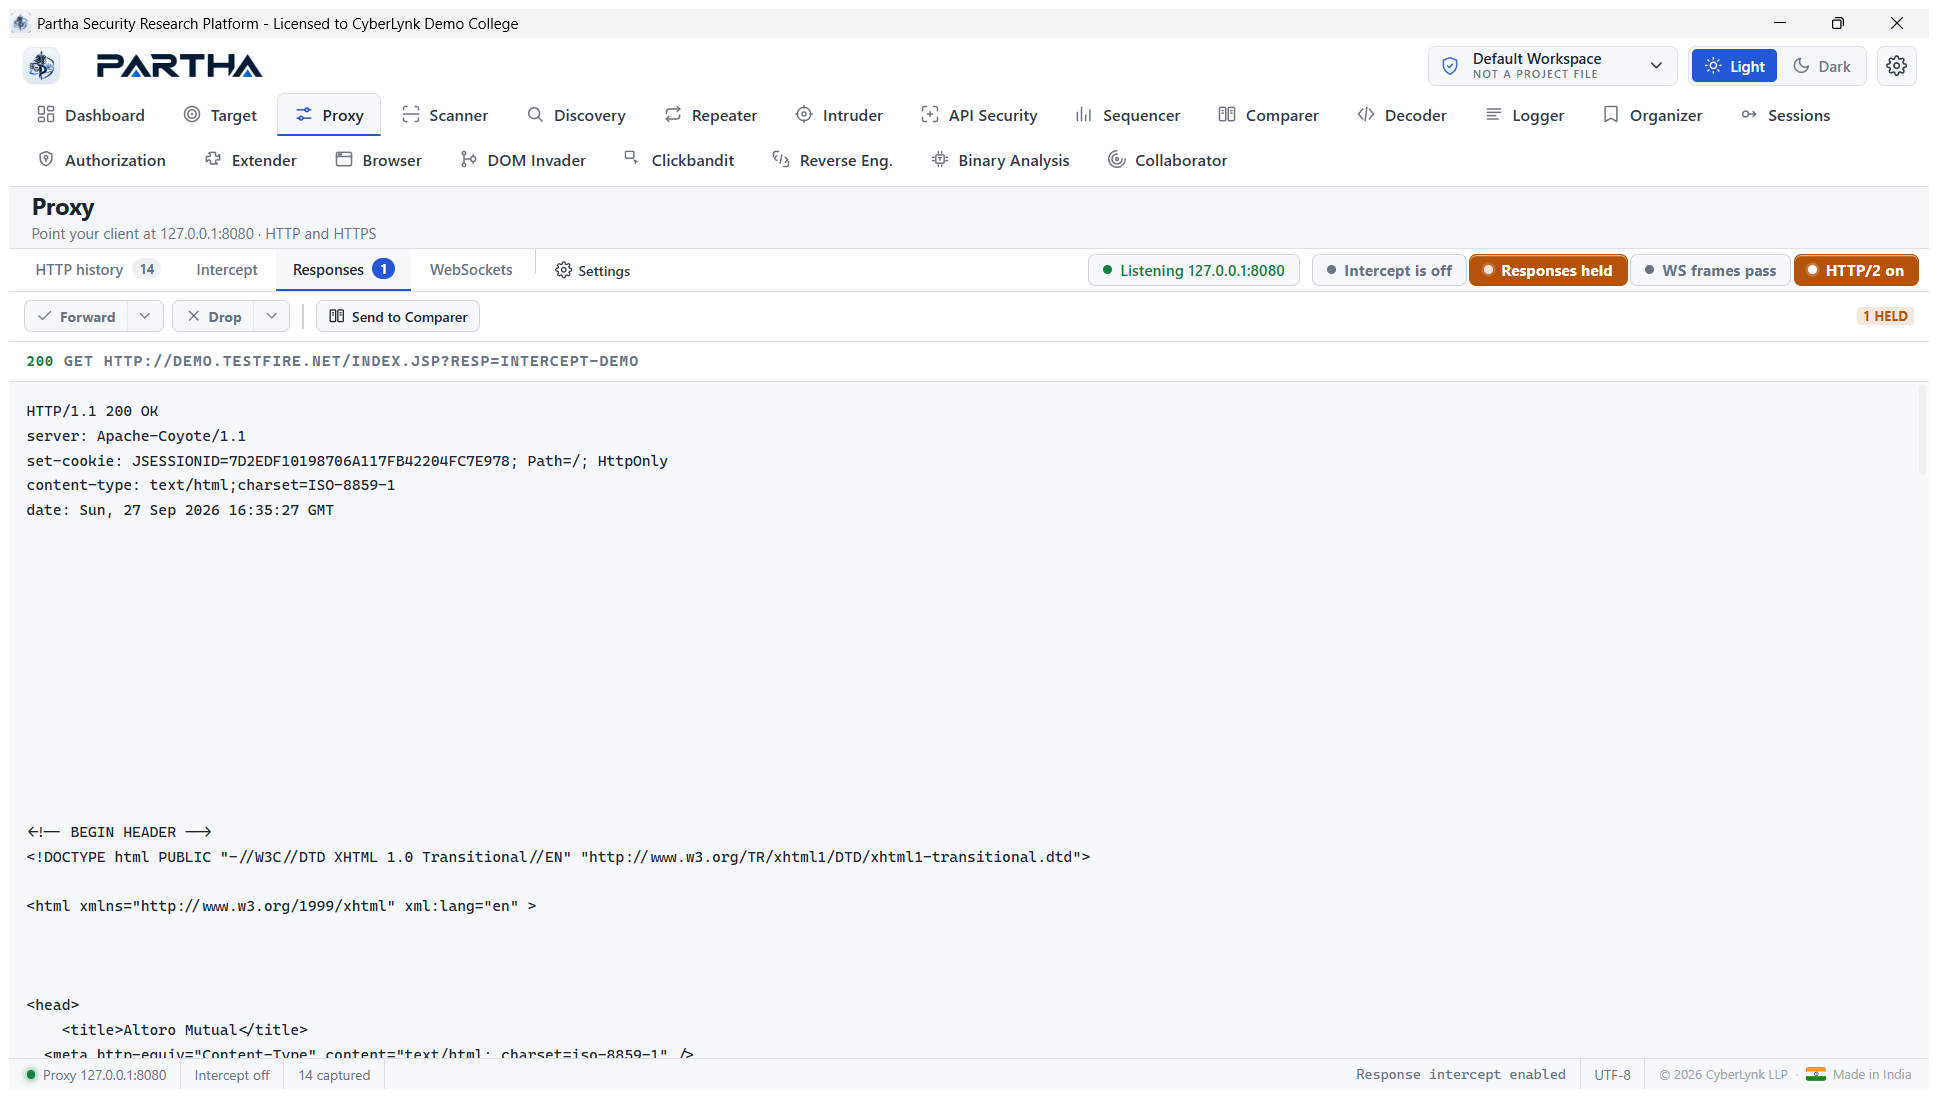
Responses — the same breakpoint for responses. Toggle Responses pass to
Responses held; here a real 200 response to /index.jsp is held (1
HELD), editable before it reaches the client:
WebSockets — WebSocket upgrades are relayed end-to-end and recorded per
frame; the built-in WebSocket Repeater (the ws://… + Connect bar) opens
one directly. Below it is live-connected to a WebSocket echo server, with a
sent frame in the log:
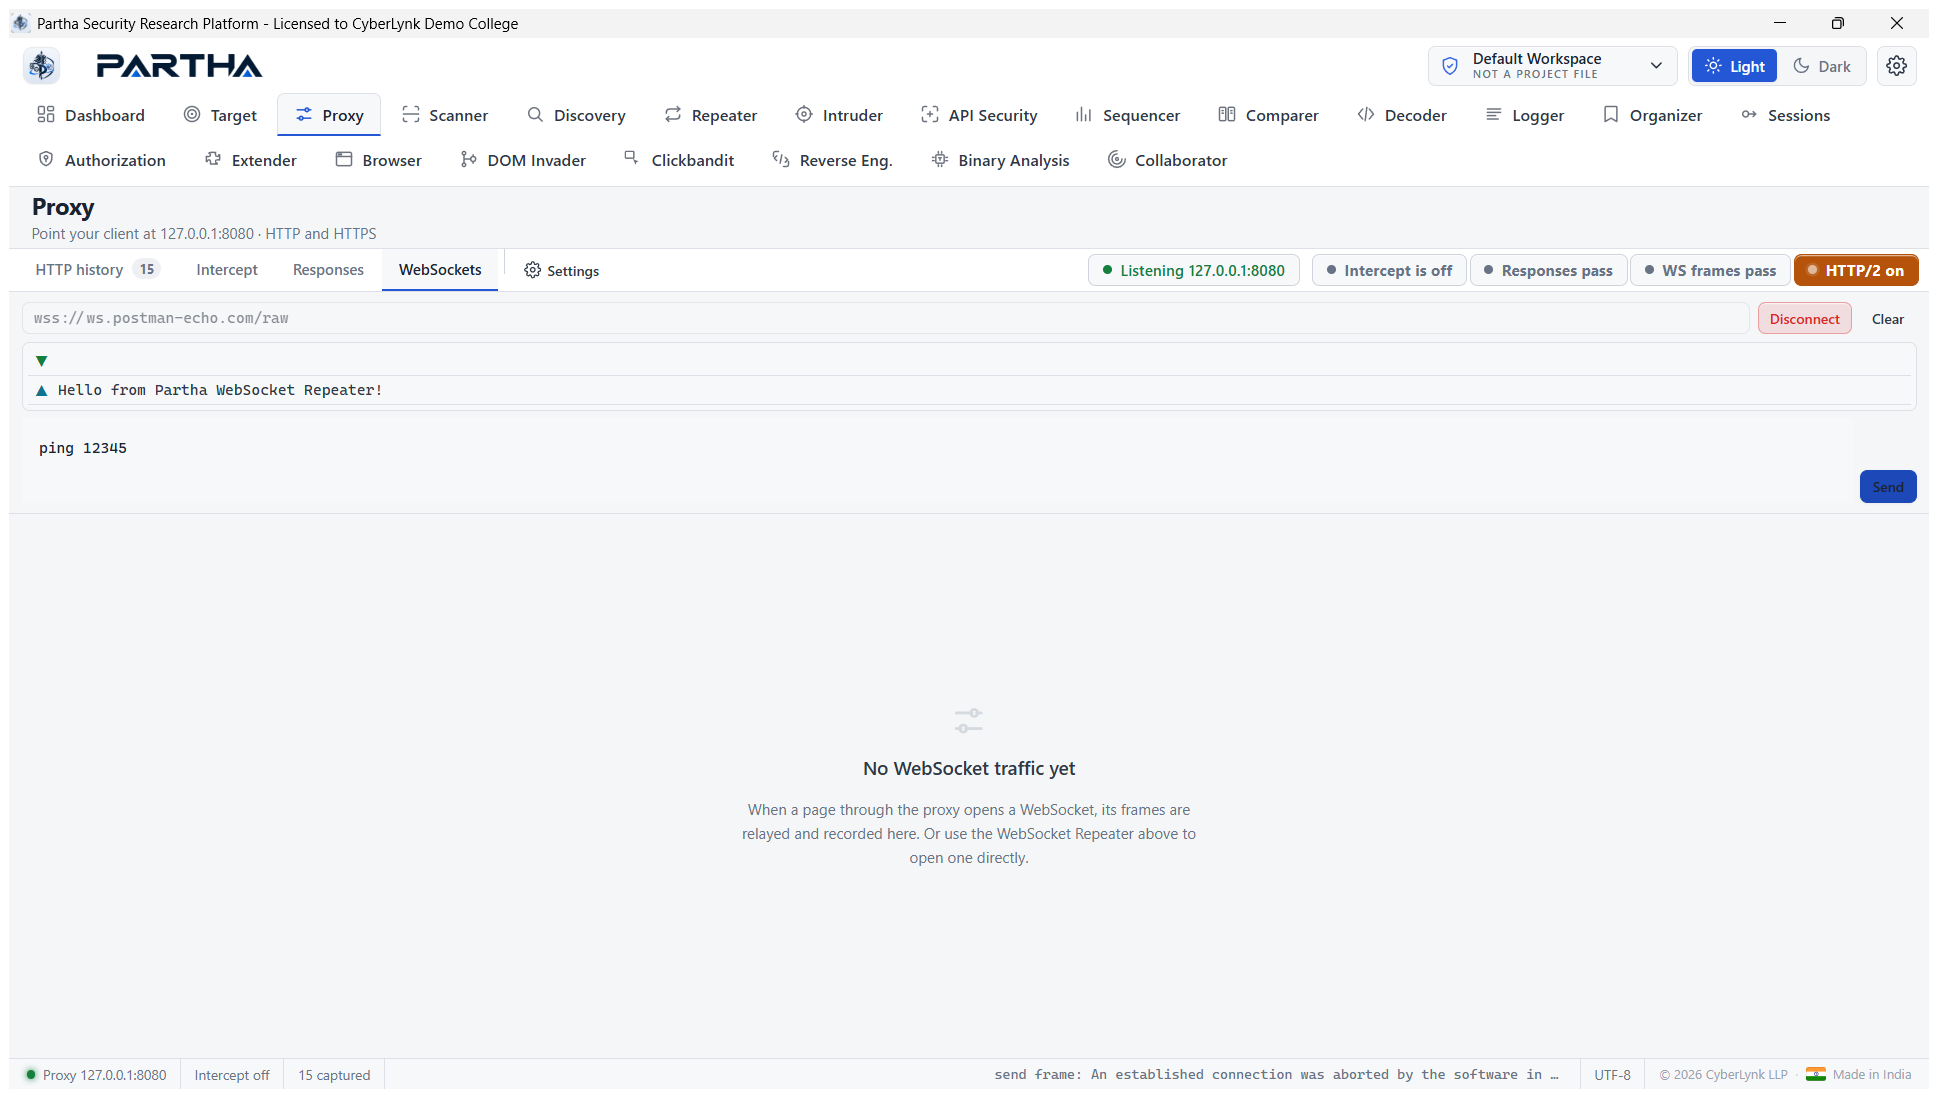
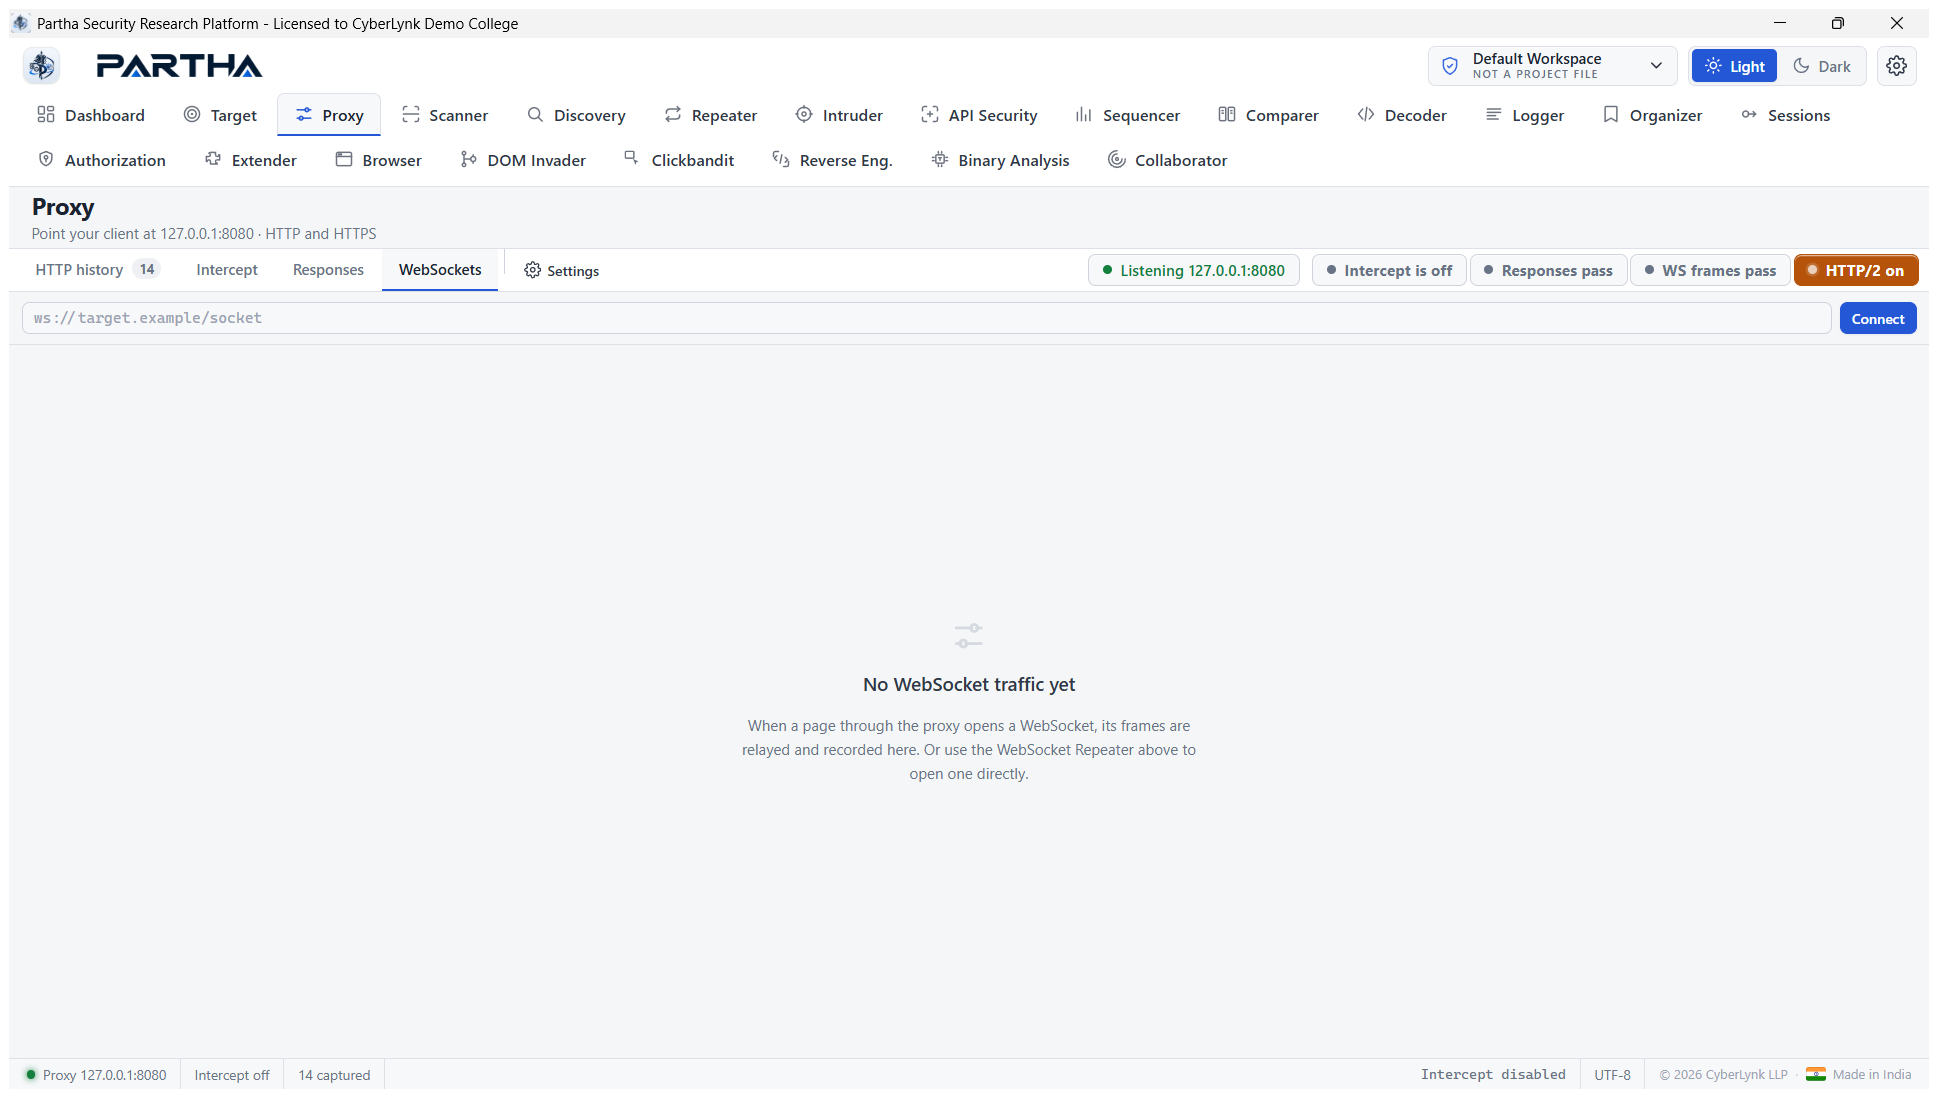
(The empty-state view — before any WebSocket traffic — looks like this:)
Settings — bind address, port, and the interception CA certificate (Reinstall / Download / Generate new):
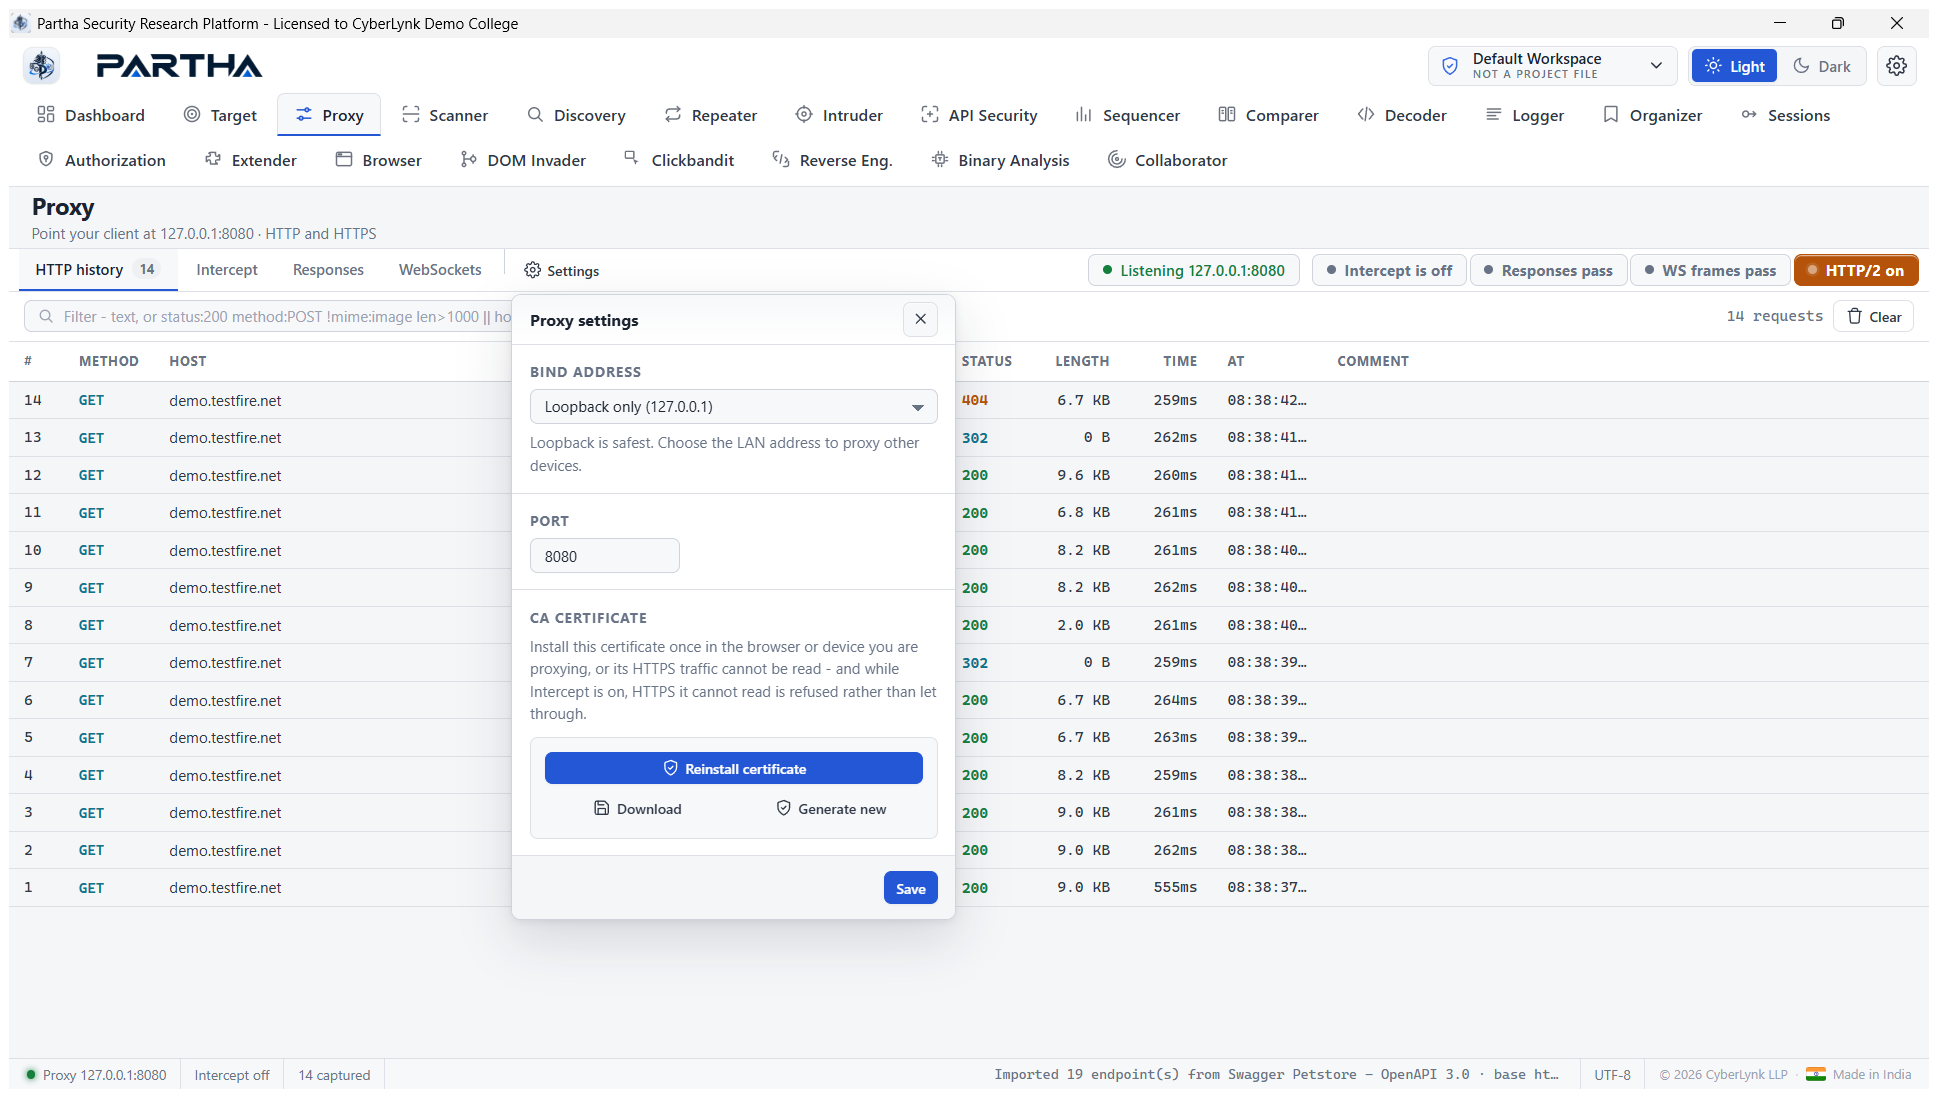
HTTPS is decrypted transparently once the CA (§4.2) is trusted. HTTP/2 connections are negotiated over ALPN and rendered in the HTTP/1-style editor. Match & replace request and response rules are configured in Extender (§6.16) and applied here automatically.
Steps to capture: point your client (or the Browser tool) at 127.0.0.1:8080,
browse the target, watch rows fill HTTP history, then right-click a row to
send it anywhere (§7).
6.4 Scanner#
Passive scanning as you browse, active auditing of URLs and inputs, and a built-in crawler ("crawl and audit") — optionally through the built-in browser and with authentication.
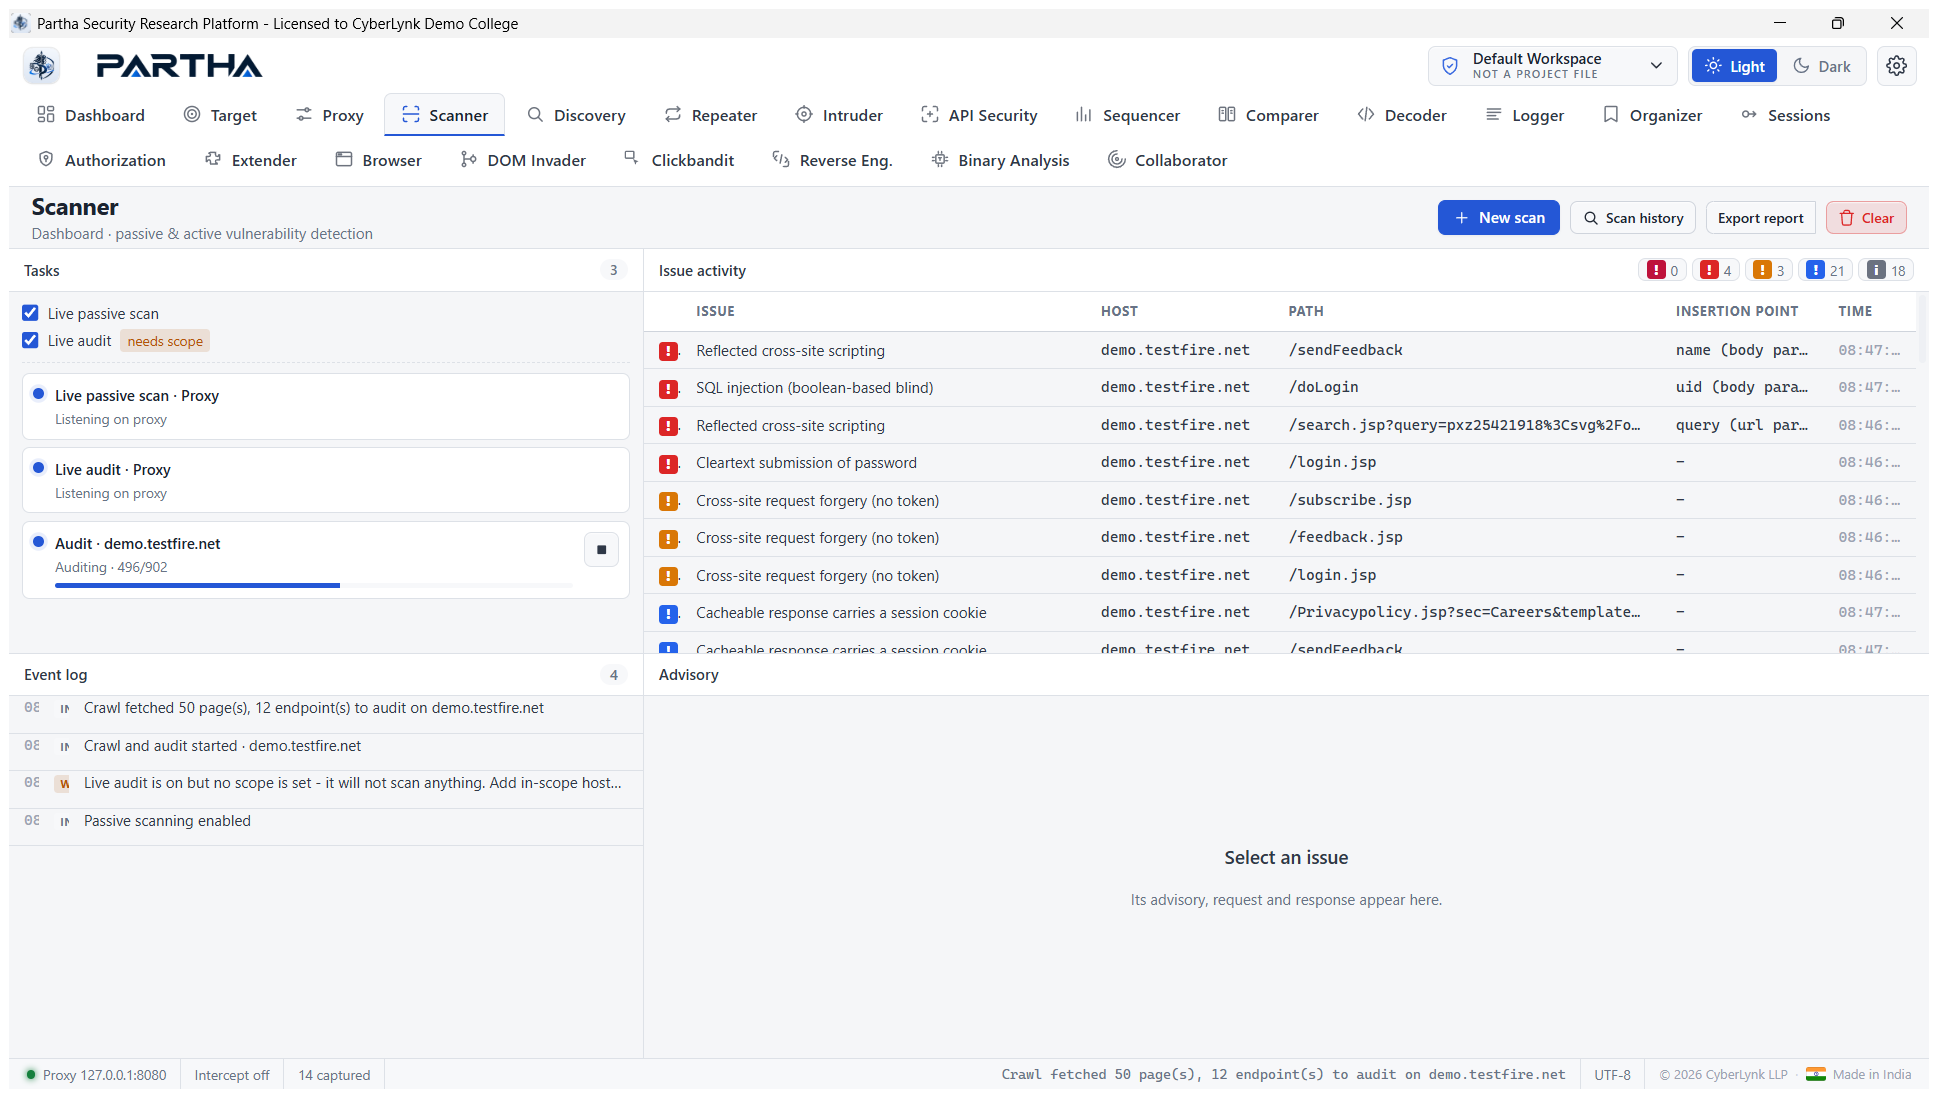
Live scanning — tick Live passive scan and Live audit to scan proxied traffic as it flows:
New scan — click + New scan, choose Crawl and audit (spider + audit) or Audit only, and enter seed URLs:
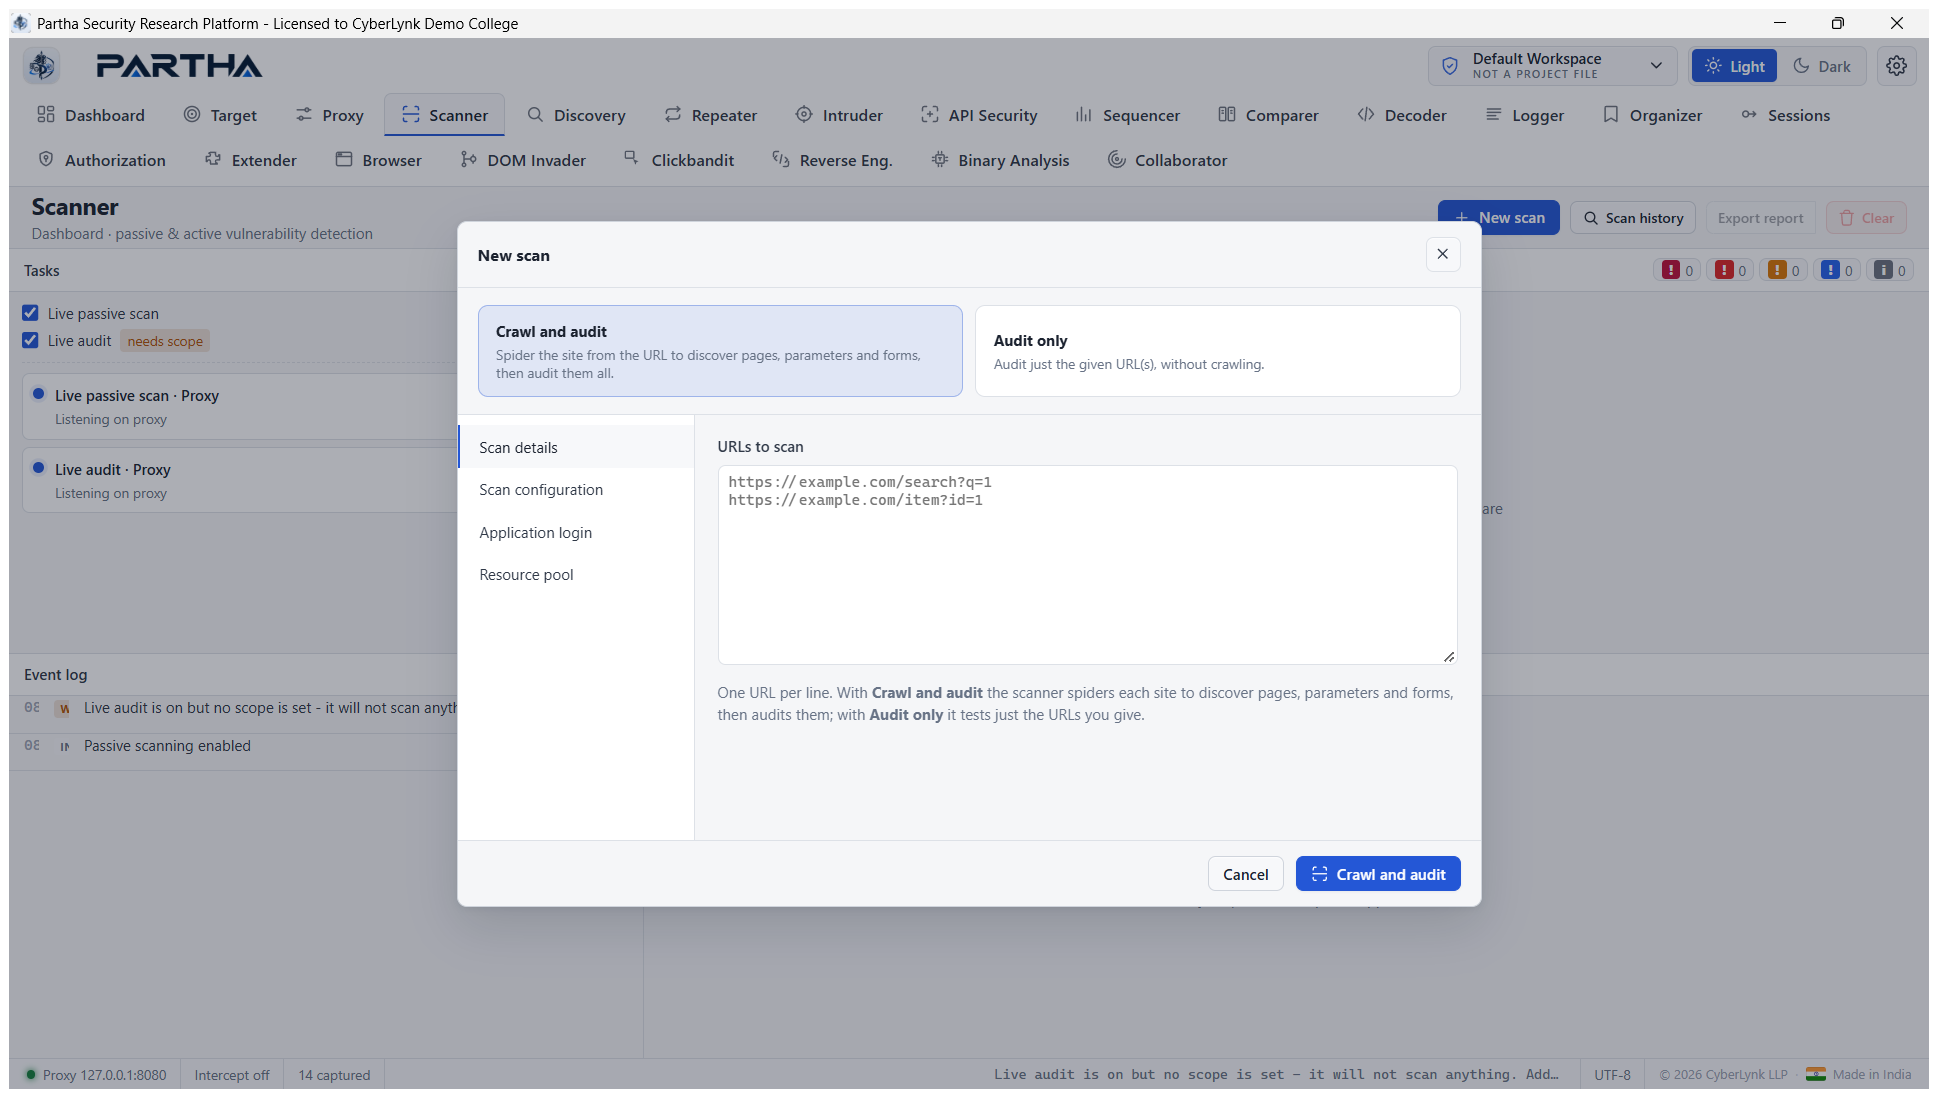
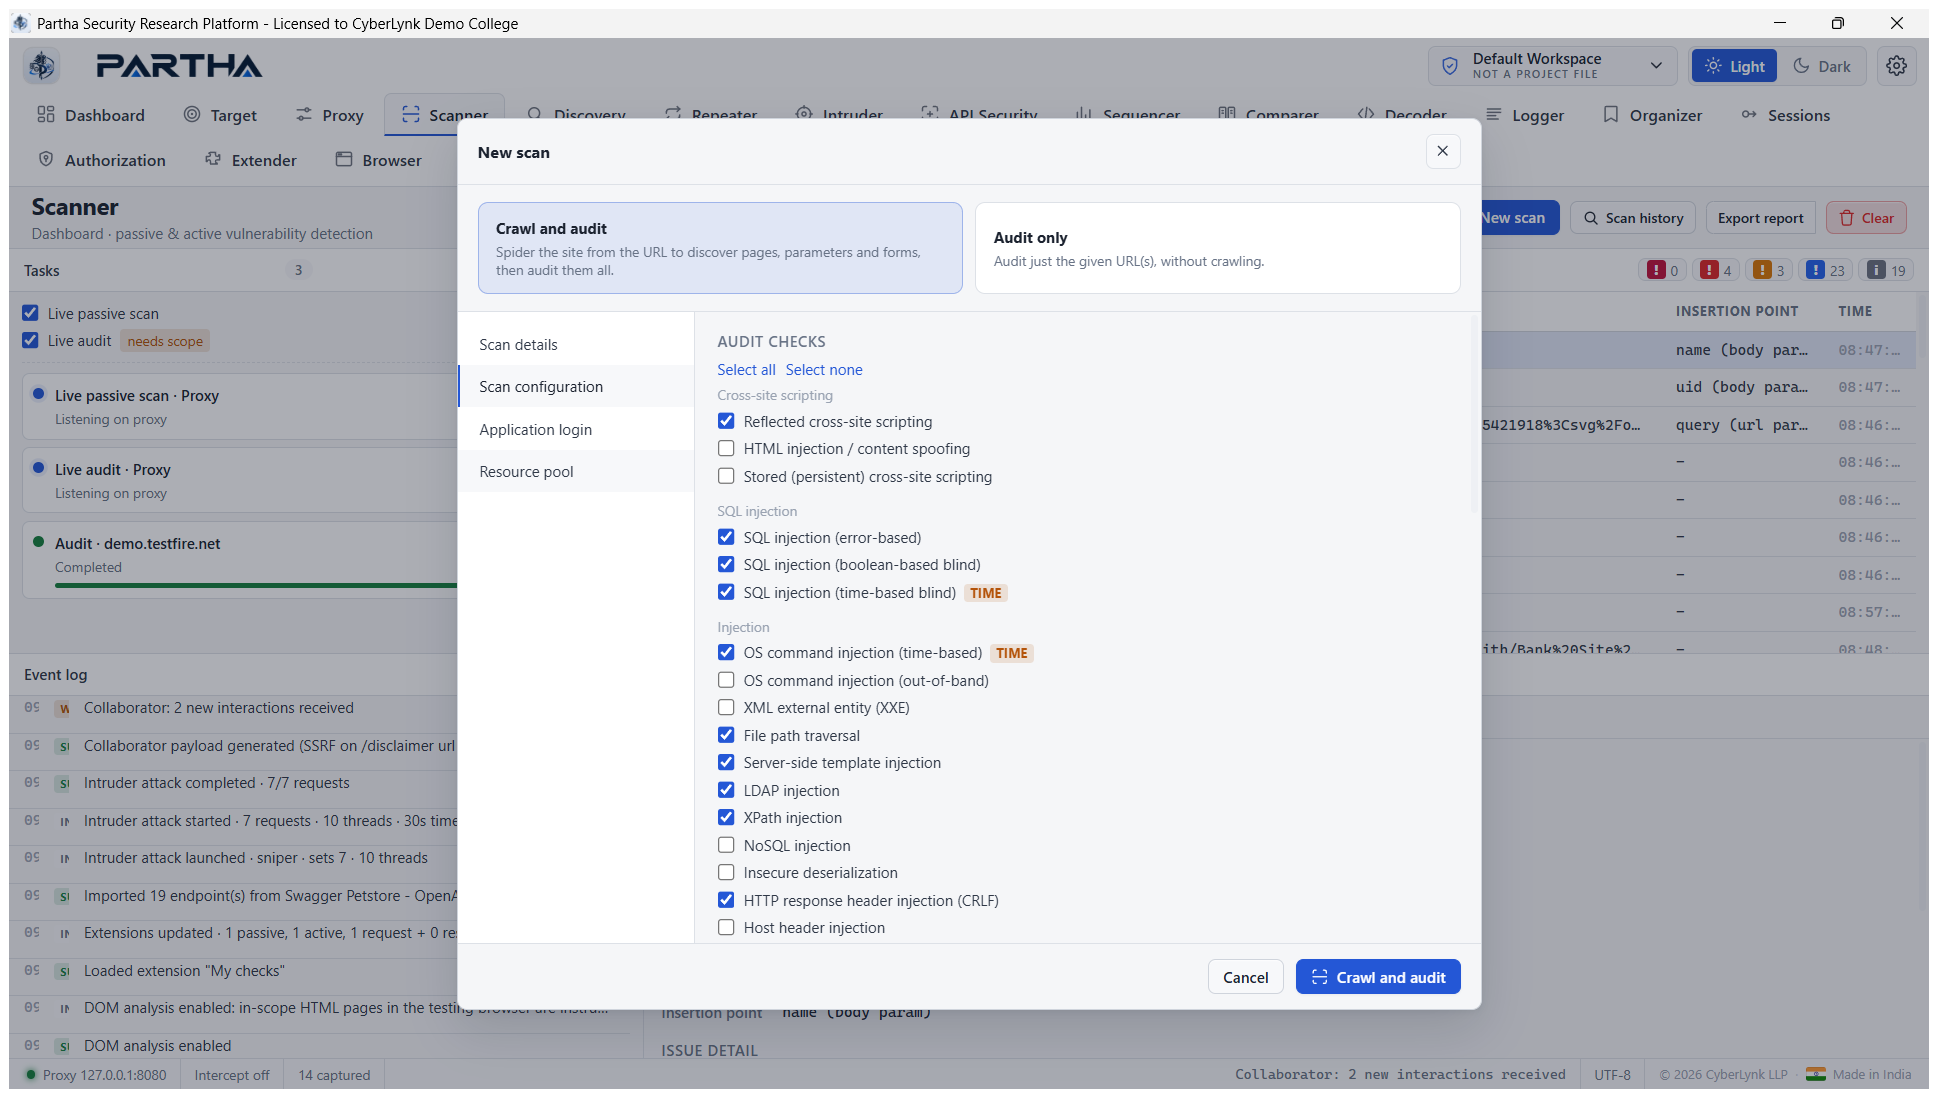
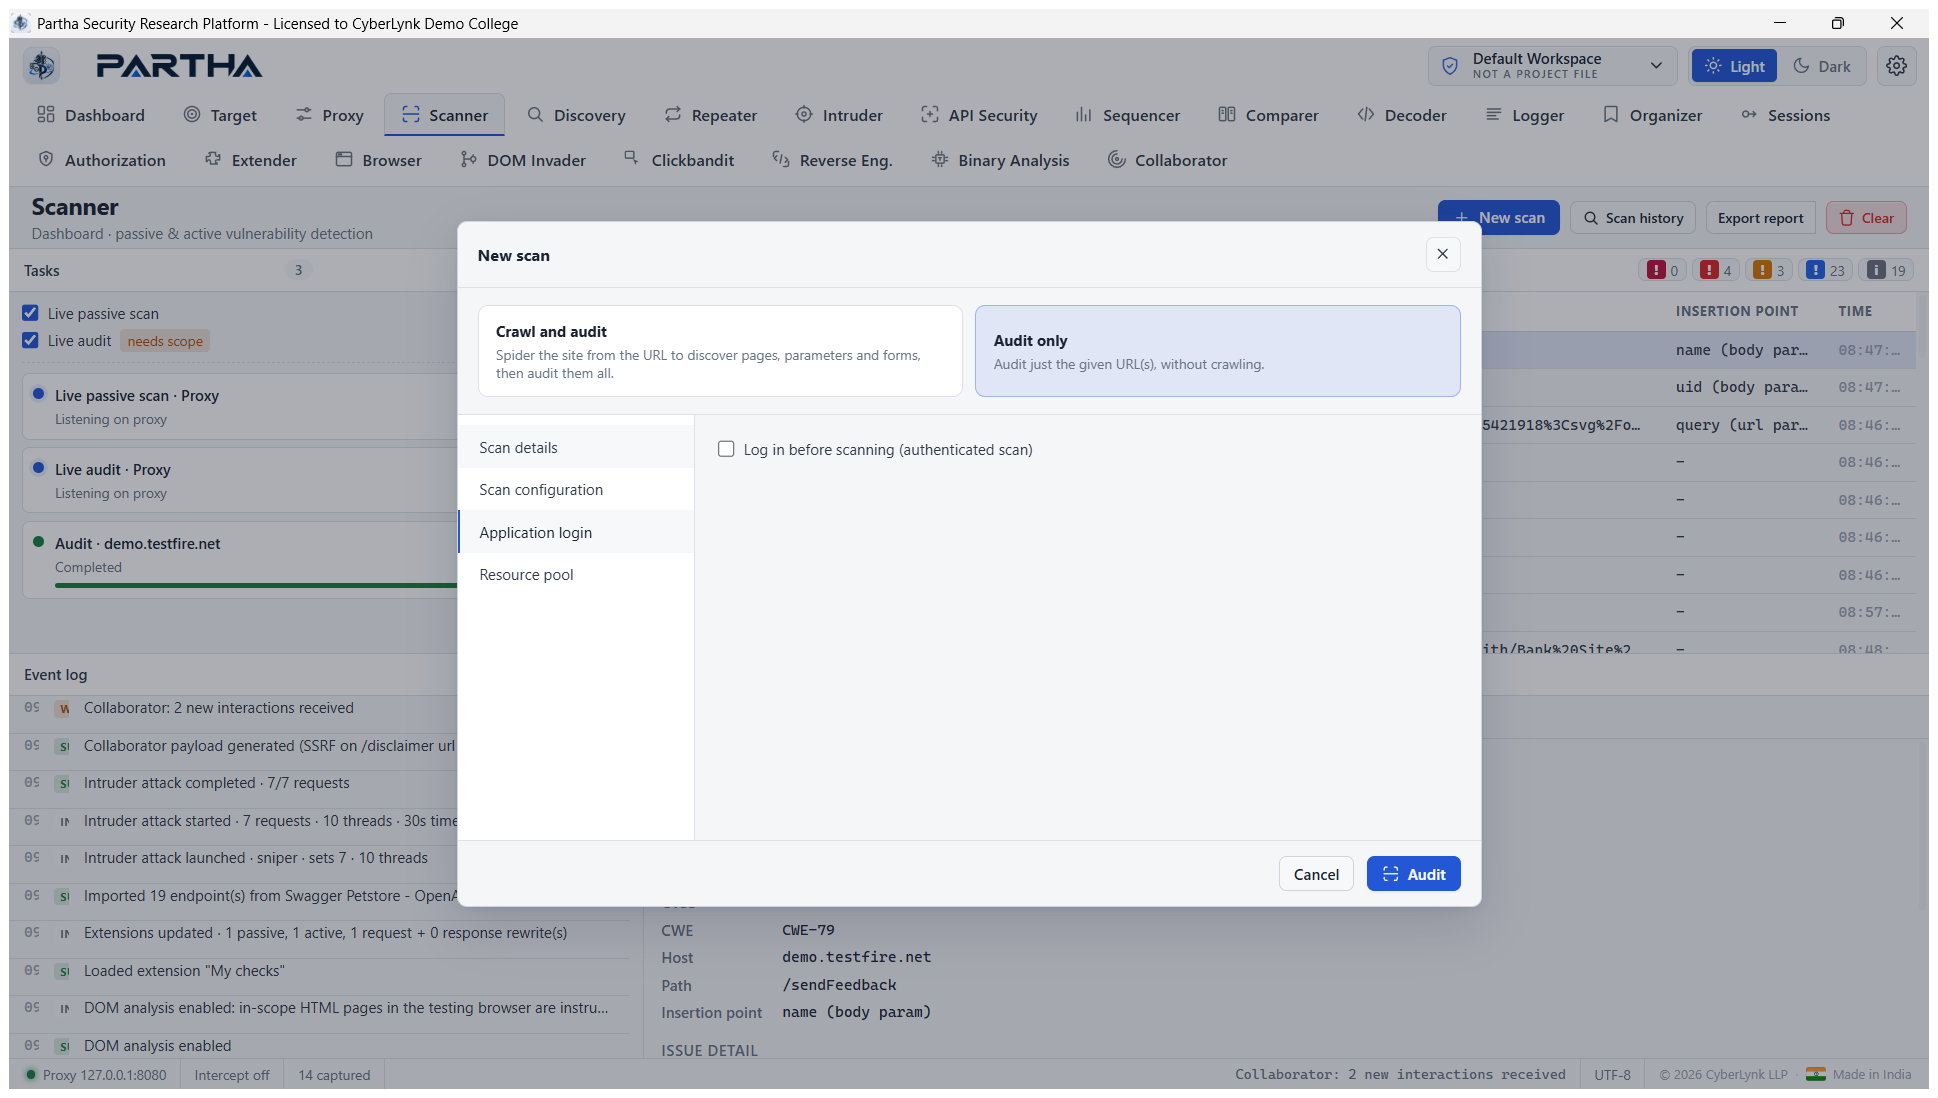
The dialog's tabs configure the scan:
-
Scan configuration — pick exactly which audit checks and insertion points run, plus speed/accuracy. Partha ships built-in configurations and accepts custom ones:
-
Application login — "Log in before scanning (authenticated scan)" for privileged-area coverage:
-
Resource pool — global concurrency/throttle.
Real result — crawl-and-audit on http://demo.testfire.net/ fetched 50
pages / 12 endpoints and ran 902 probes to produce 48 findings (4 high, 3
medium, 22 low, 19 info):
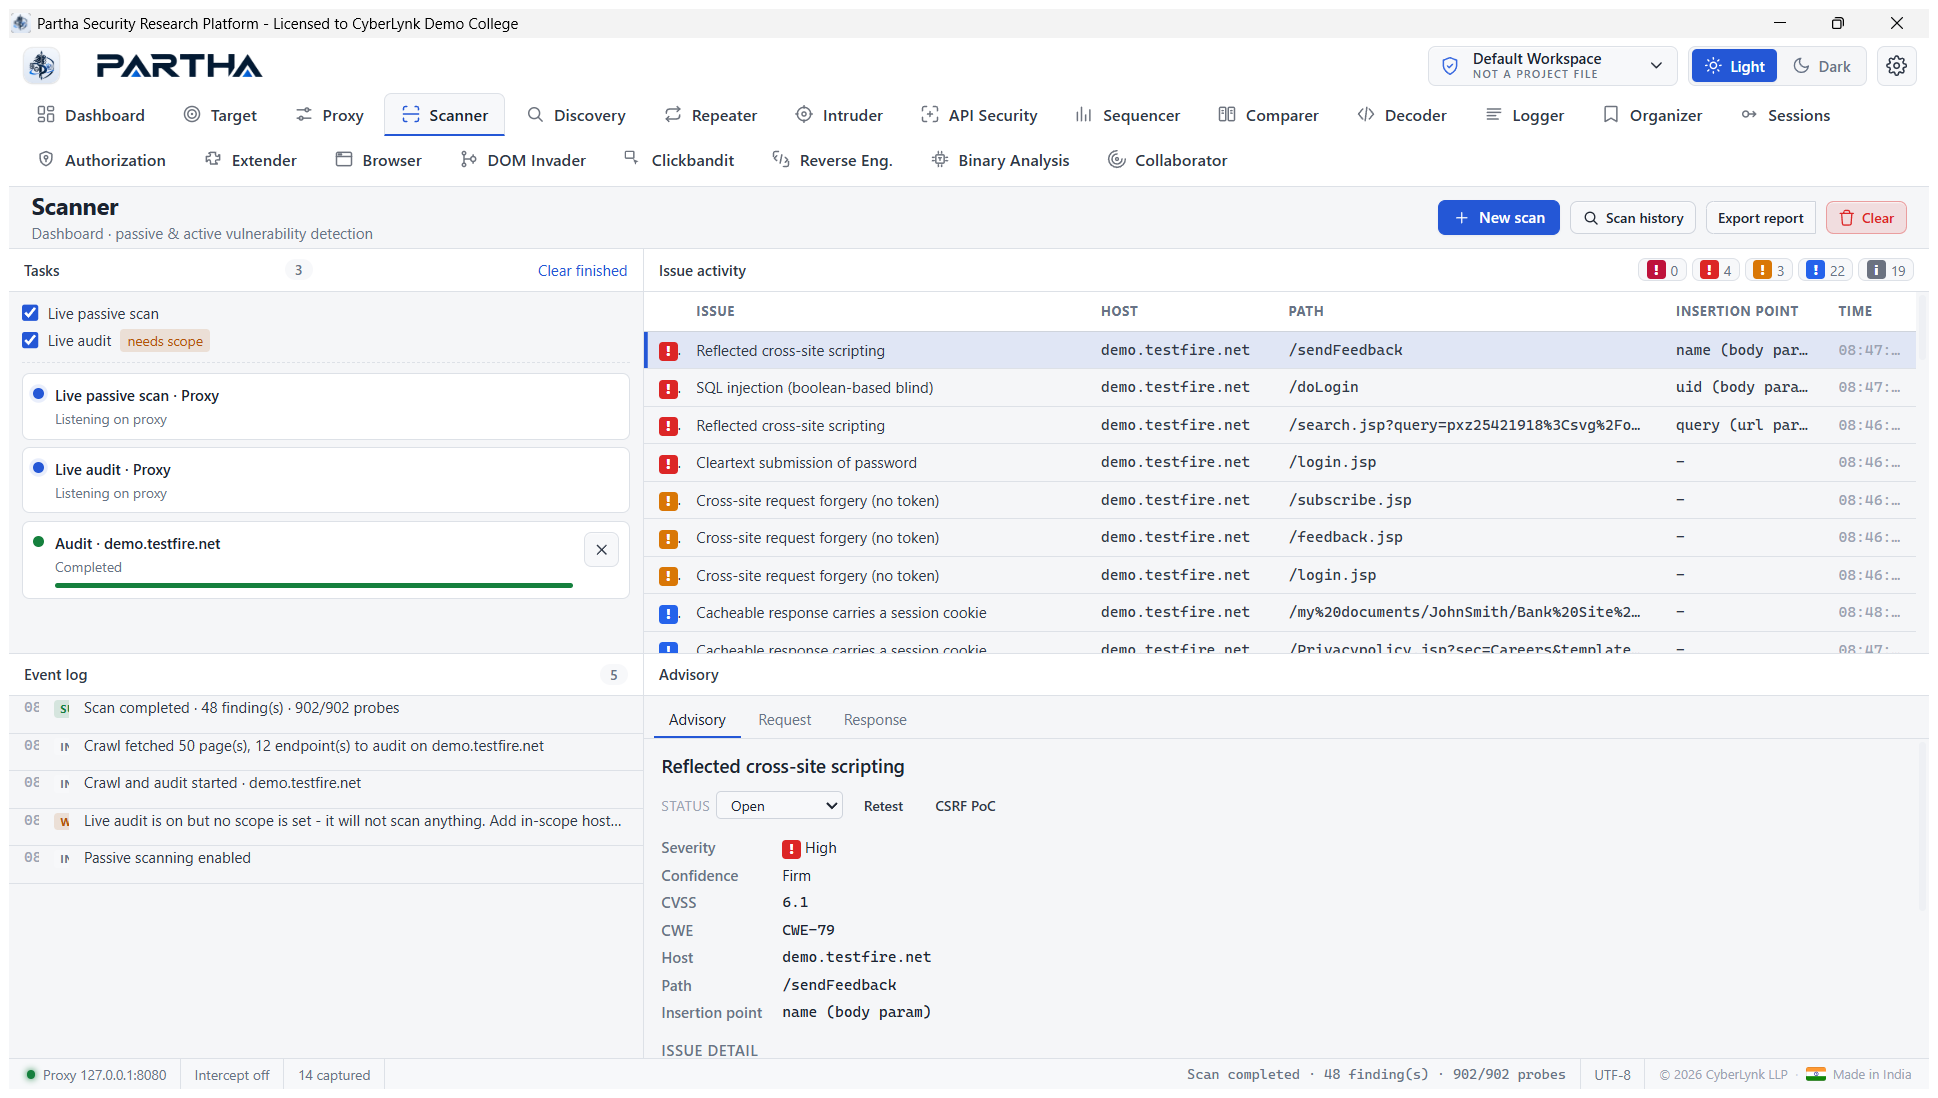
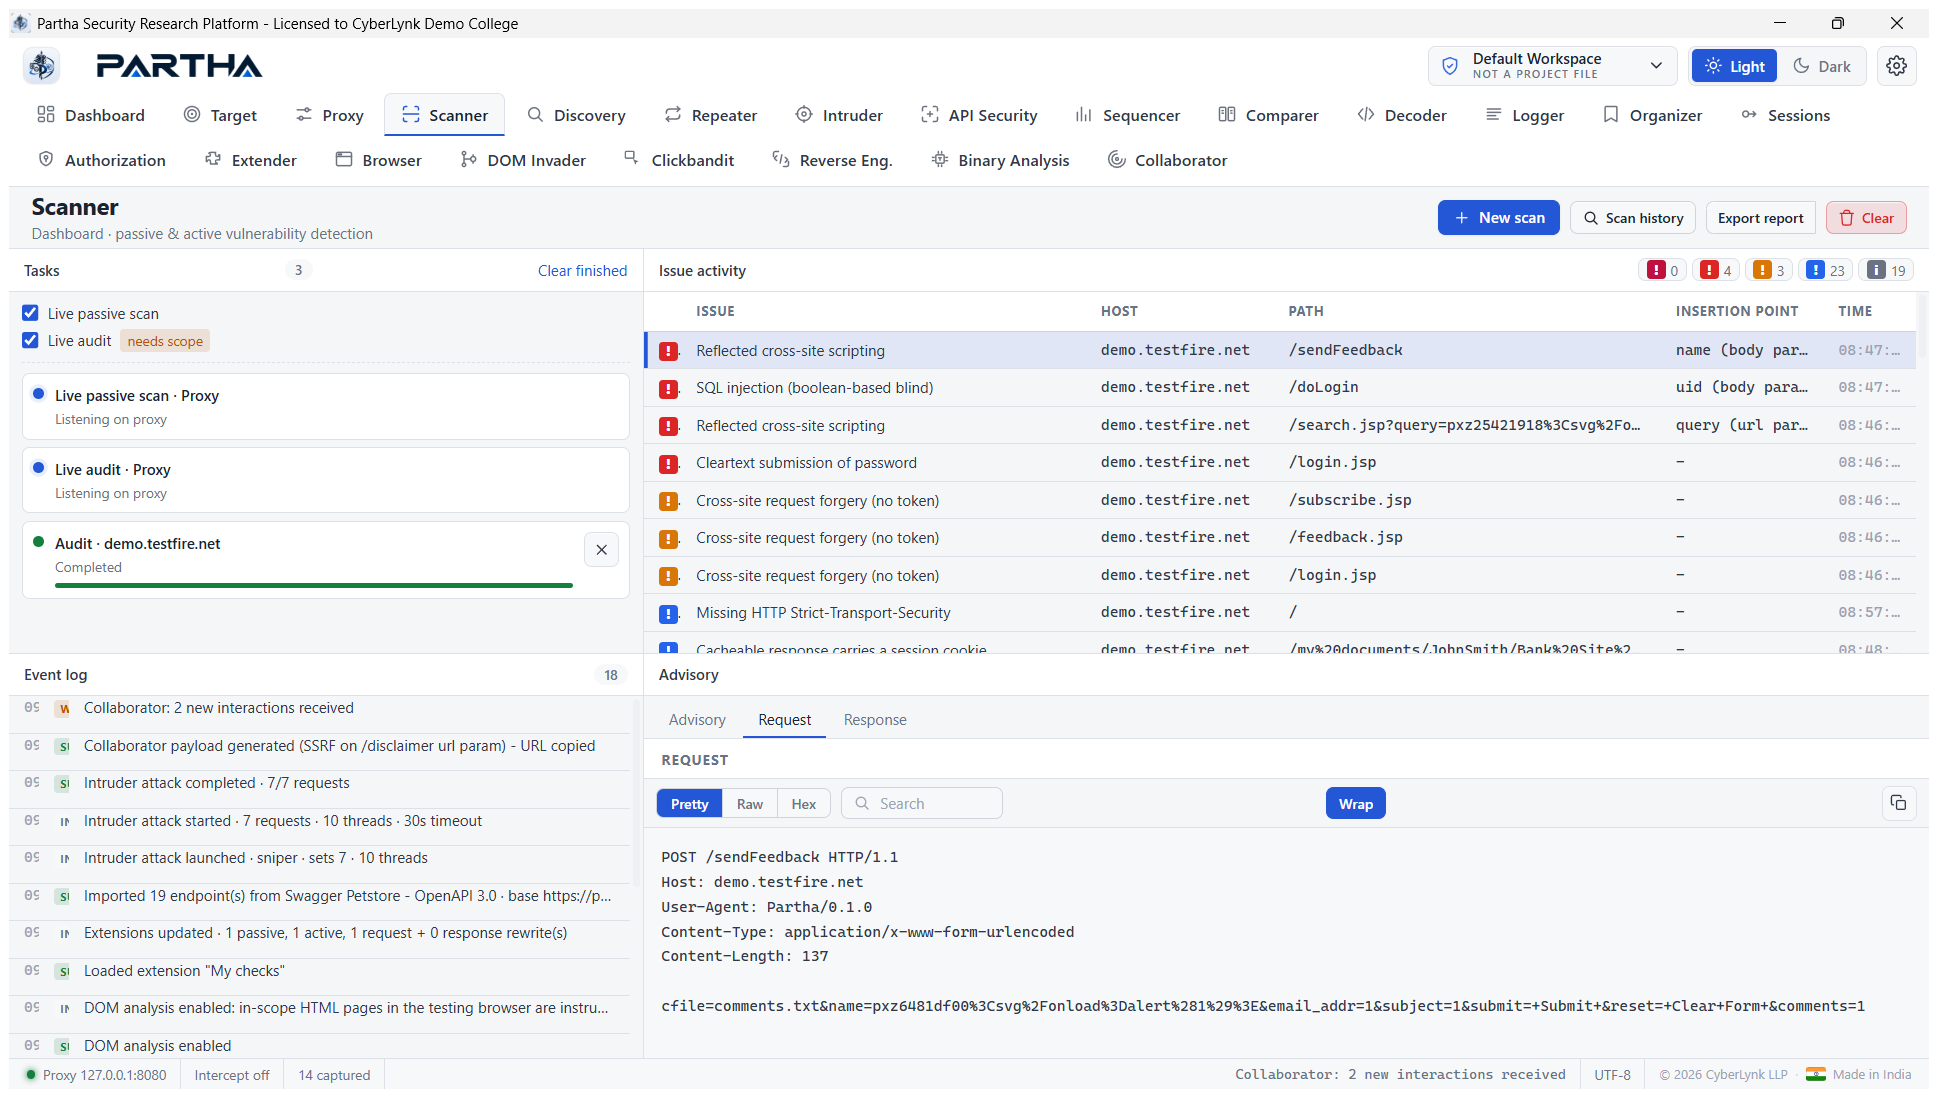
Selecting a finding opens the Advisory (description, Severity, Confidence, CVSS, CWE, host/path/insertion-point) with Status (triage), Retest and CSRF PoC buttons. The Request and Response tabs show the exact exchange — here the actual reflected-XSS attack request that Partha sent:
The check set covers reflected/stored XSS, SQLi (error/boolean/time), OS command injection, path traversal, SSTI, CRLF, open redirect, LDAP/XPath, NoSQL injection, insecure deserialization, web-cache poisoning, GraphQL introspection, prototype pollution, OAST-driven blind classes (SSRF/XXE/blind-cmdi — §6.22), and a broad passive set. "Fuel vulnerability coverage with logic" is delivered by custom BChecks and the scripting runtime in Extender (§6.16).
6.5 Content Discovery#
Expose hidden attack surface by brute-forcing static and dynamic URLs from a wordlist, with soft-404 awareness. Hits flow into HTTP history and the site map.
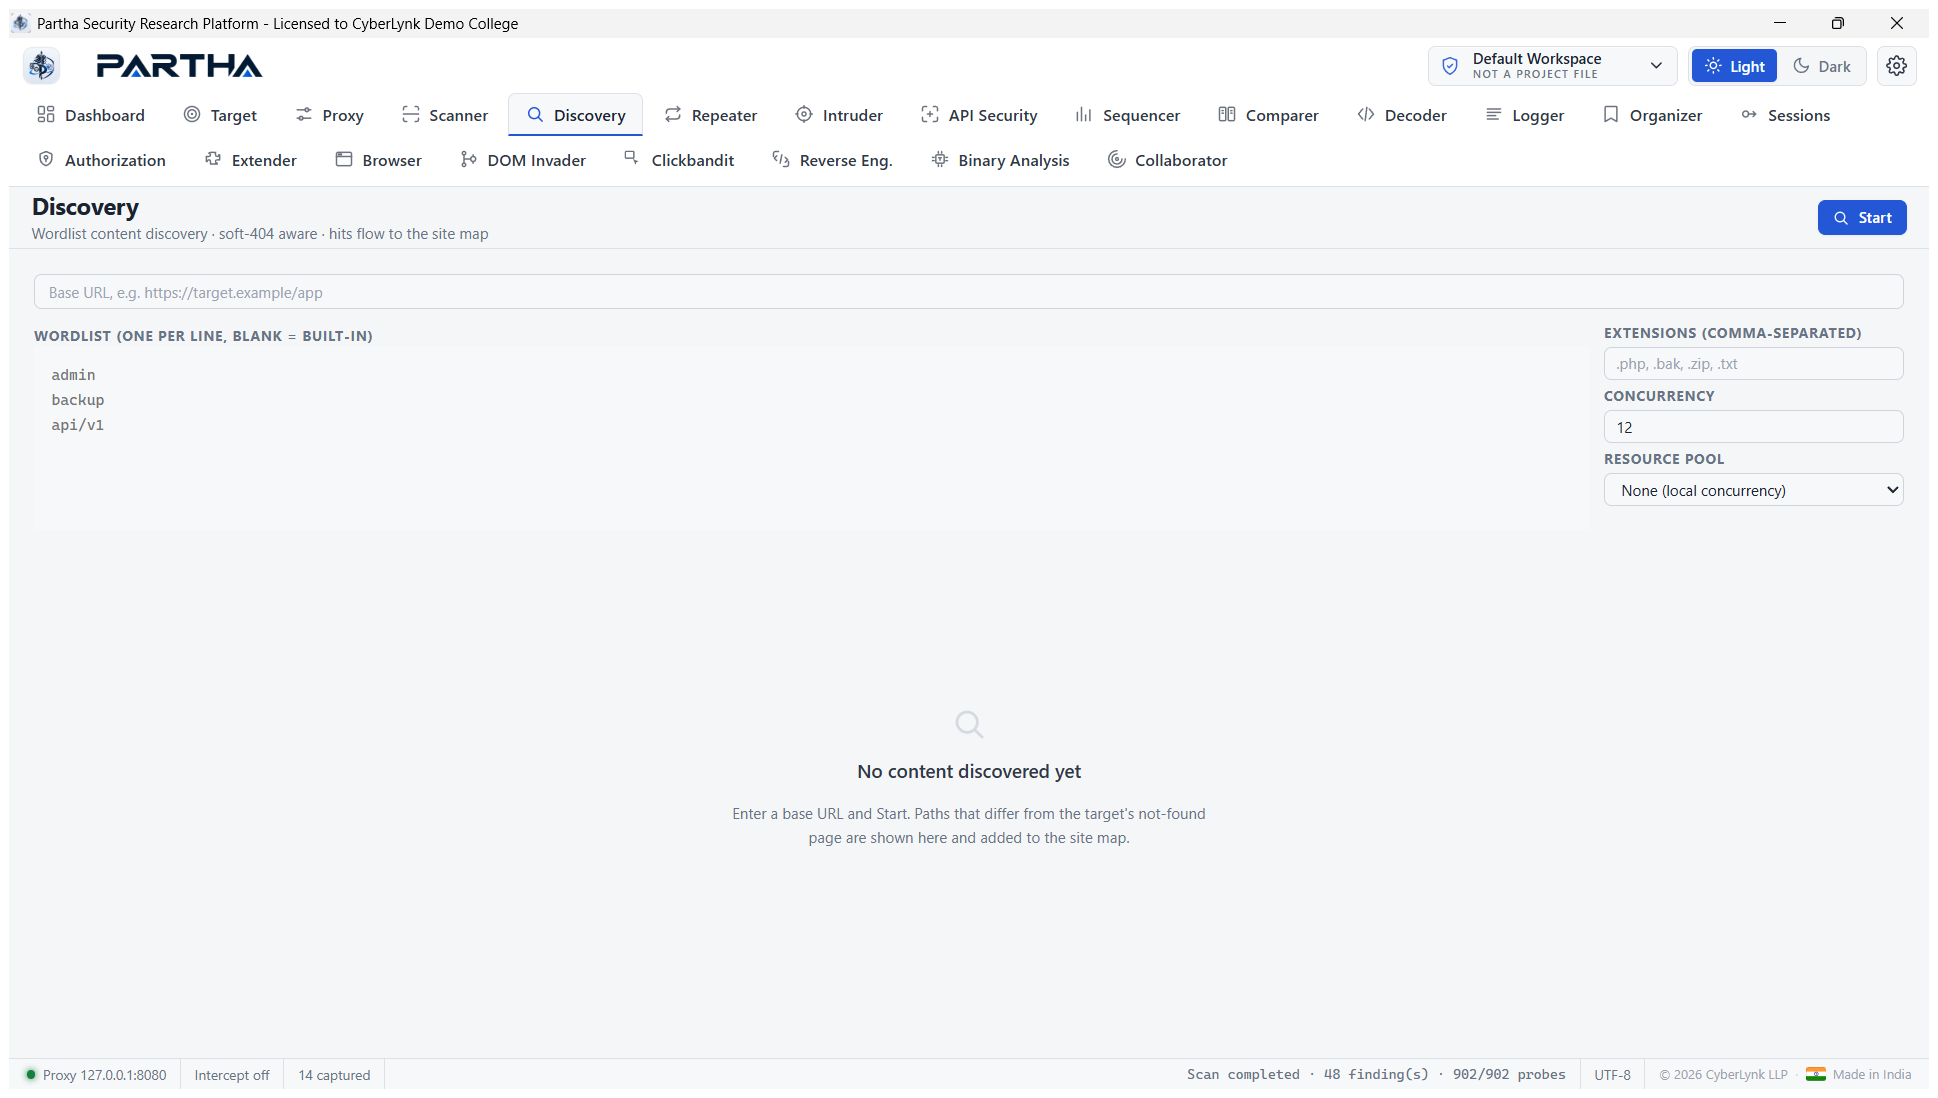
Steps: enter a Base URL, optionally a wordlist (blank = built-in) and
extensions (.php,.bak,.zip,.txt), set concurrency / resource pool,
then Start. Combined with the Scanner's crawler (§6.4) this enumerates both
static paths and dynamic parameterized endpoints.
6.6 Repeater#
The feature-rich HTTP editor — manually edit and replay any request, with tabs, protocol switching, and automatic pretty-printing.
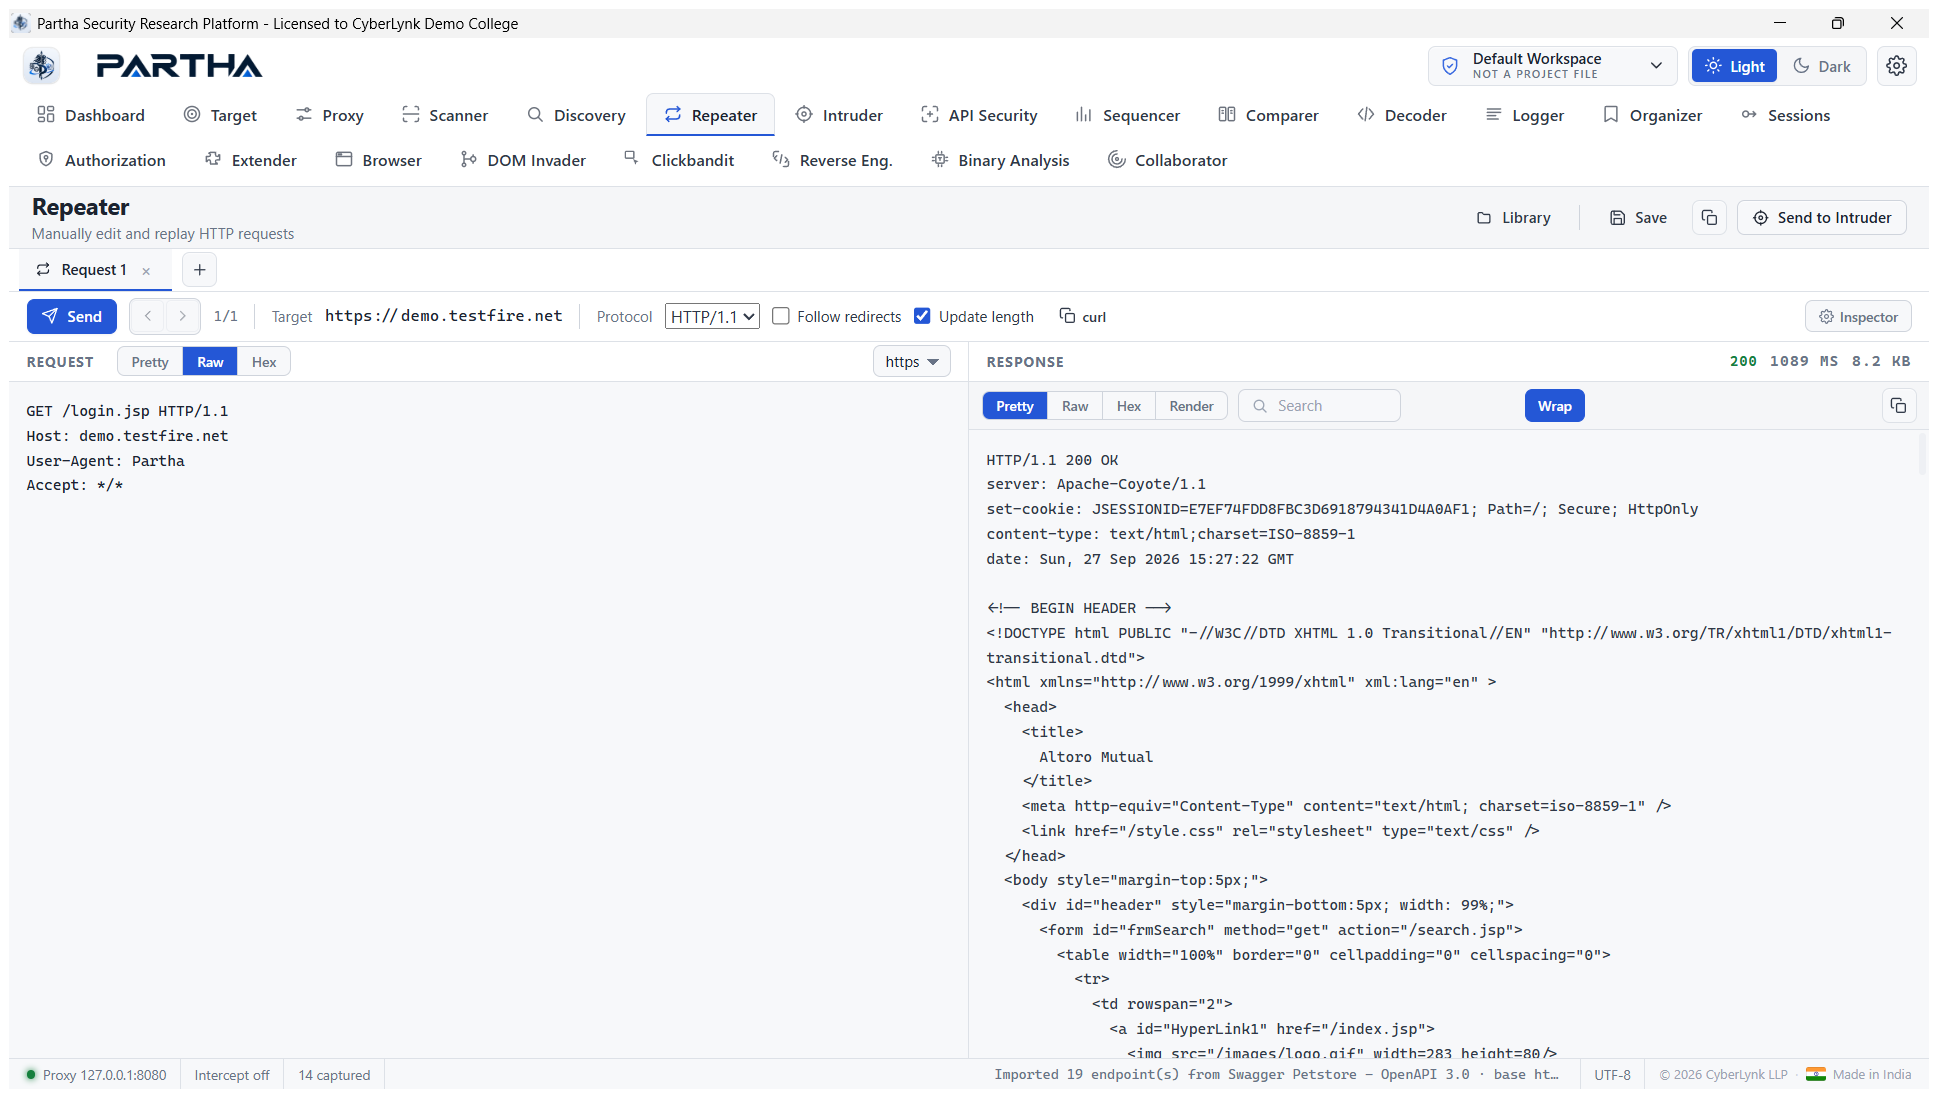
A real replay: GET /login.jsp to demo.testfire.net returning 200 OK
in 1089 ms / 8.2 KB, Raw request/response side by side:
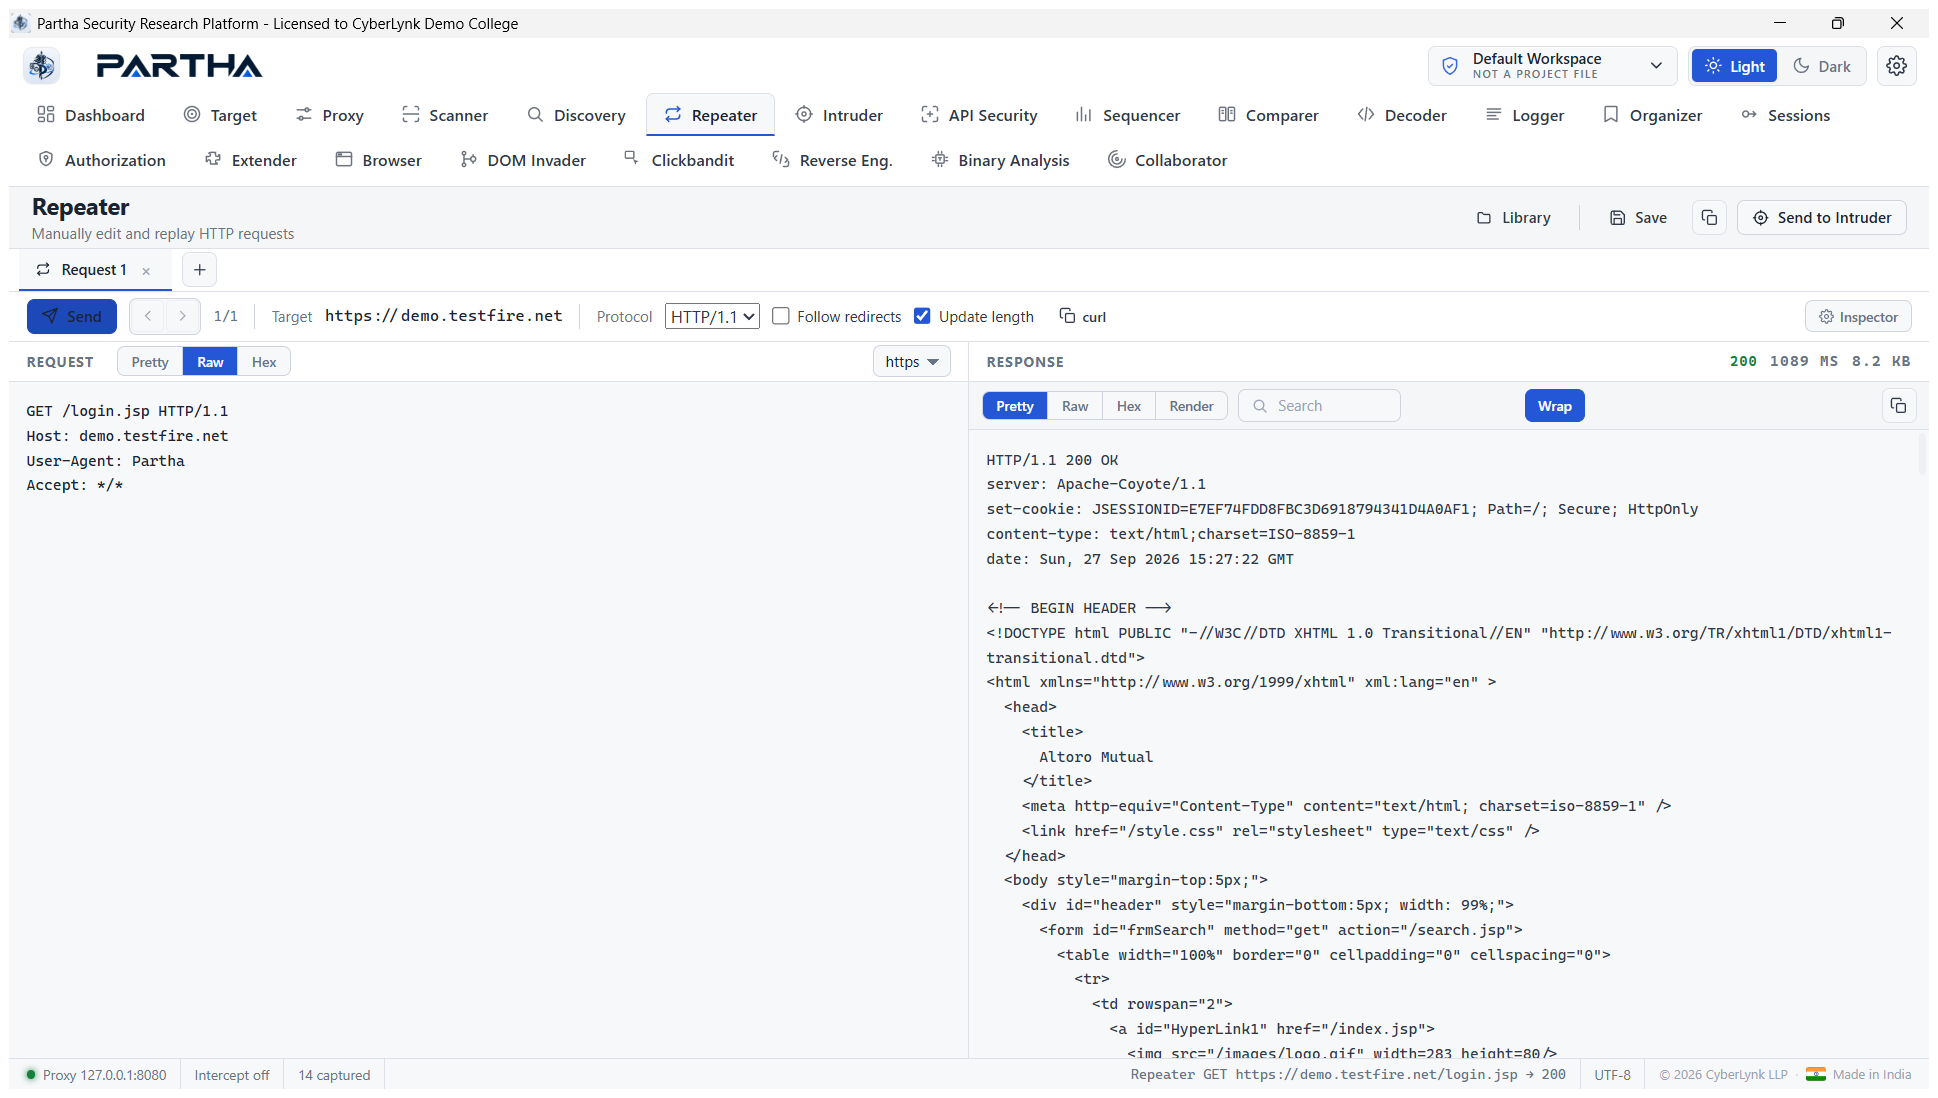
Pretty view — the Pretty tab automatically reformats JSON / JavaScript / CSS / HTML / XML by content type:
Inspector — a structured editor for query parameters, cookies, headers and attributes:
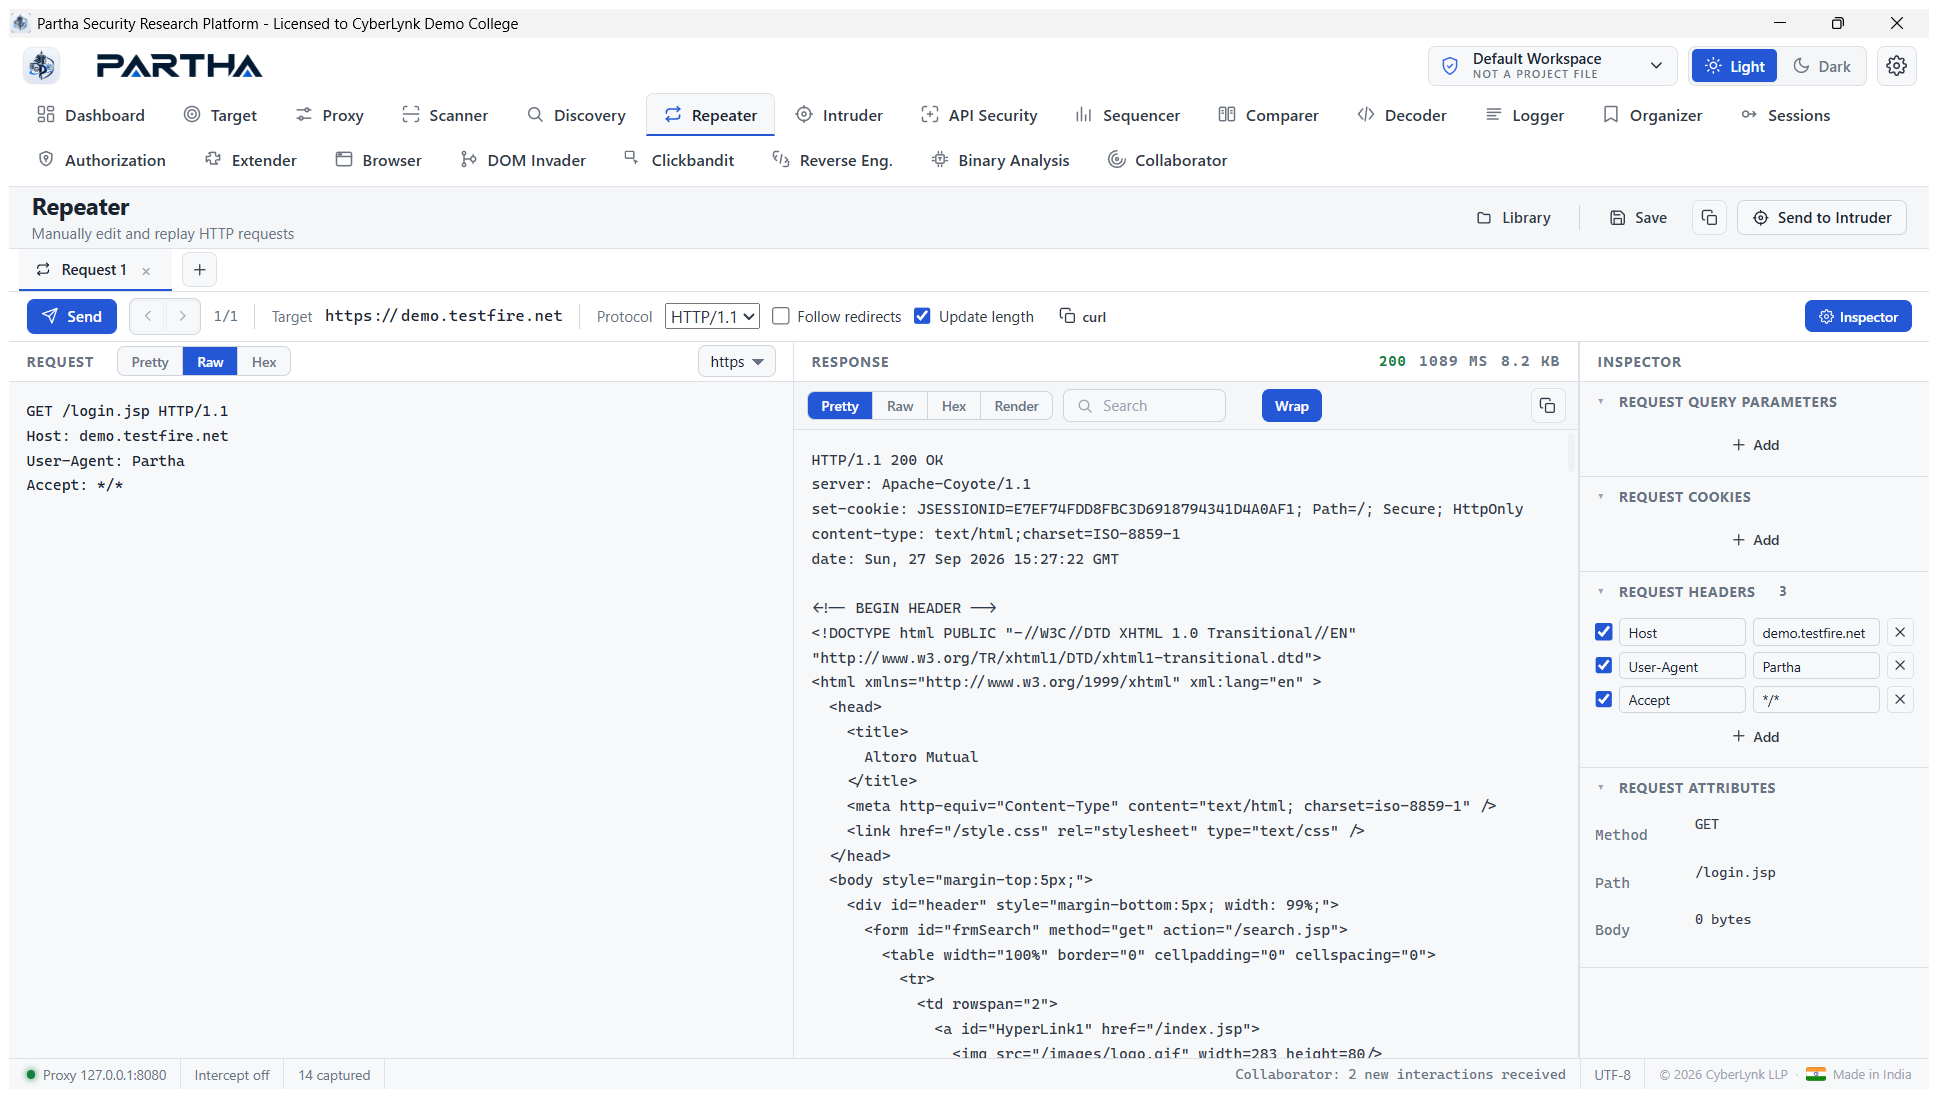
- Tabs — each an independent request; duplicate, save to Library, step through send history.
- Protocol selector — send as HTTP/1.1 or HTTP/2, with an "Exact h2" pseudo-header mode and single-packet attack.
- Request/response Pretty / Raw / Hex (+ Render), in-message search, copy as curl, Send to Intruder.
Steps: send a request here from Proxy (right-click → Send to Repeater) or
type one, edit it, and Send (Ctrl+Enter).
6.7 Intruder#
Faster brute-forcing and fuzzing with custom payload sets and attack types, and capture / filter / query of results.
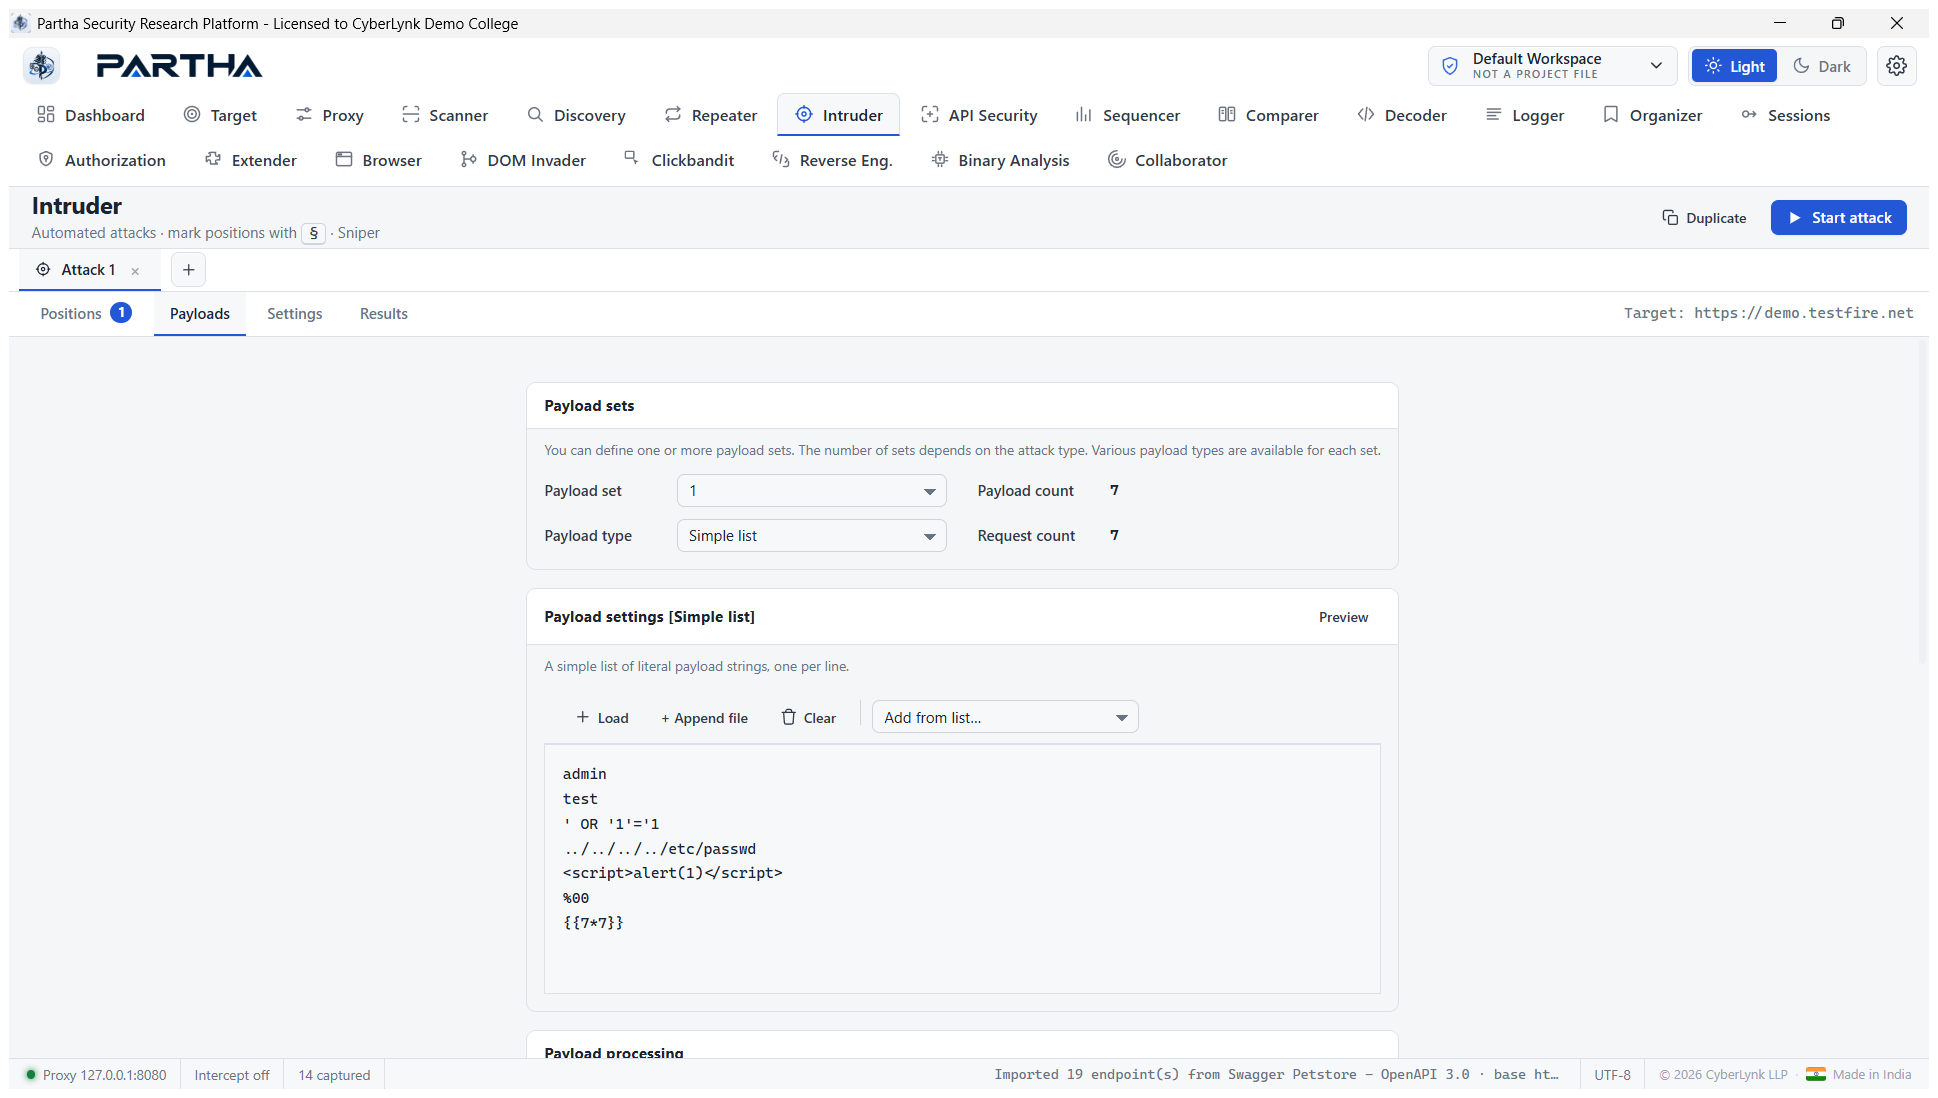
Positions & payloads — mark injection points with §…§, pick an Attack
type, and define a payload set (11 generators, plus processing rules). All
four attack types are available:
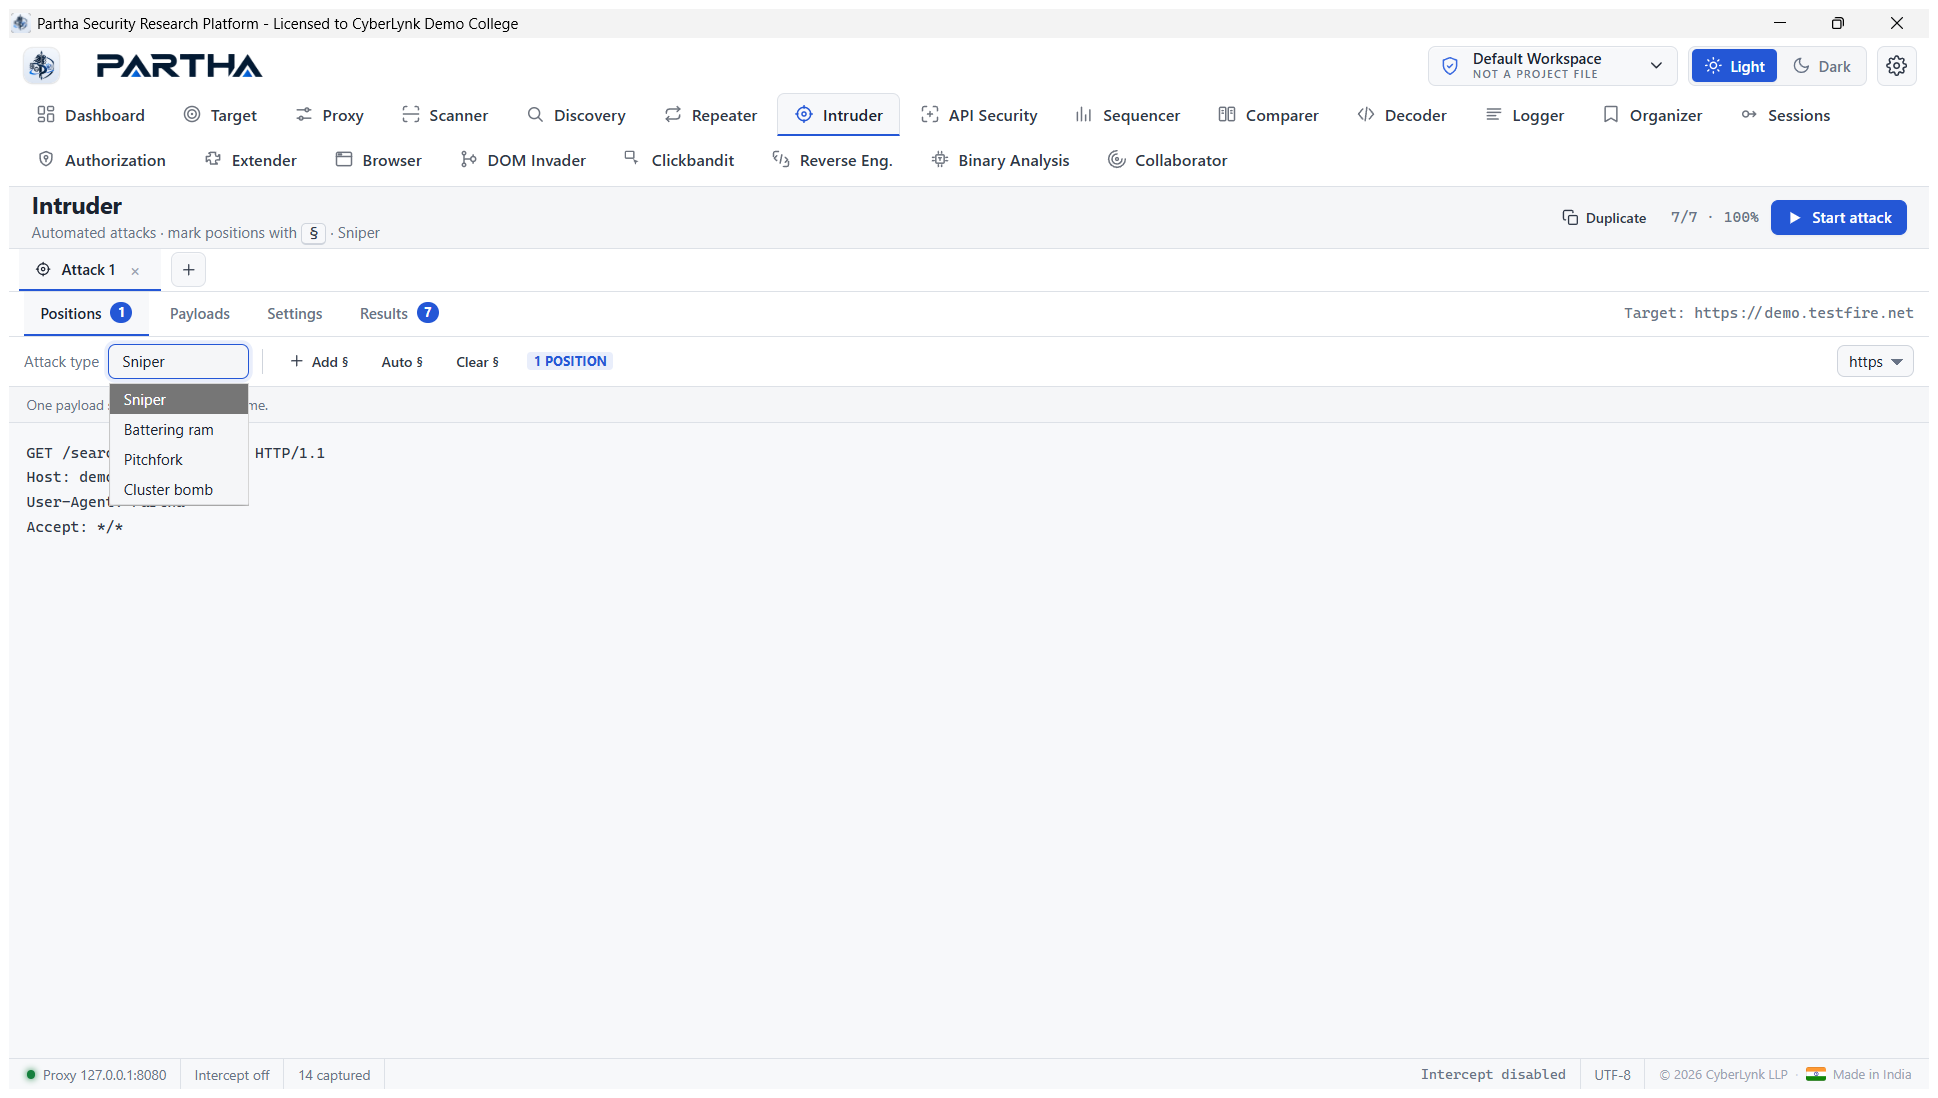
Here a Sniper attack is armed on demo.testfire.net's /search.jsp?query=§q§
with 7 payloads:
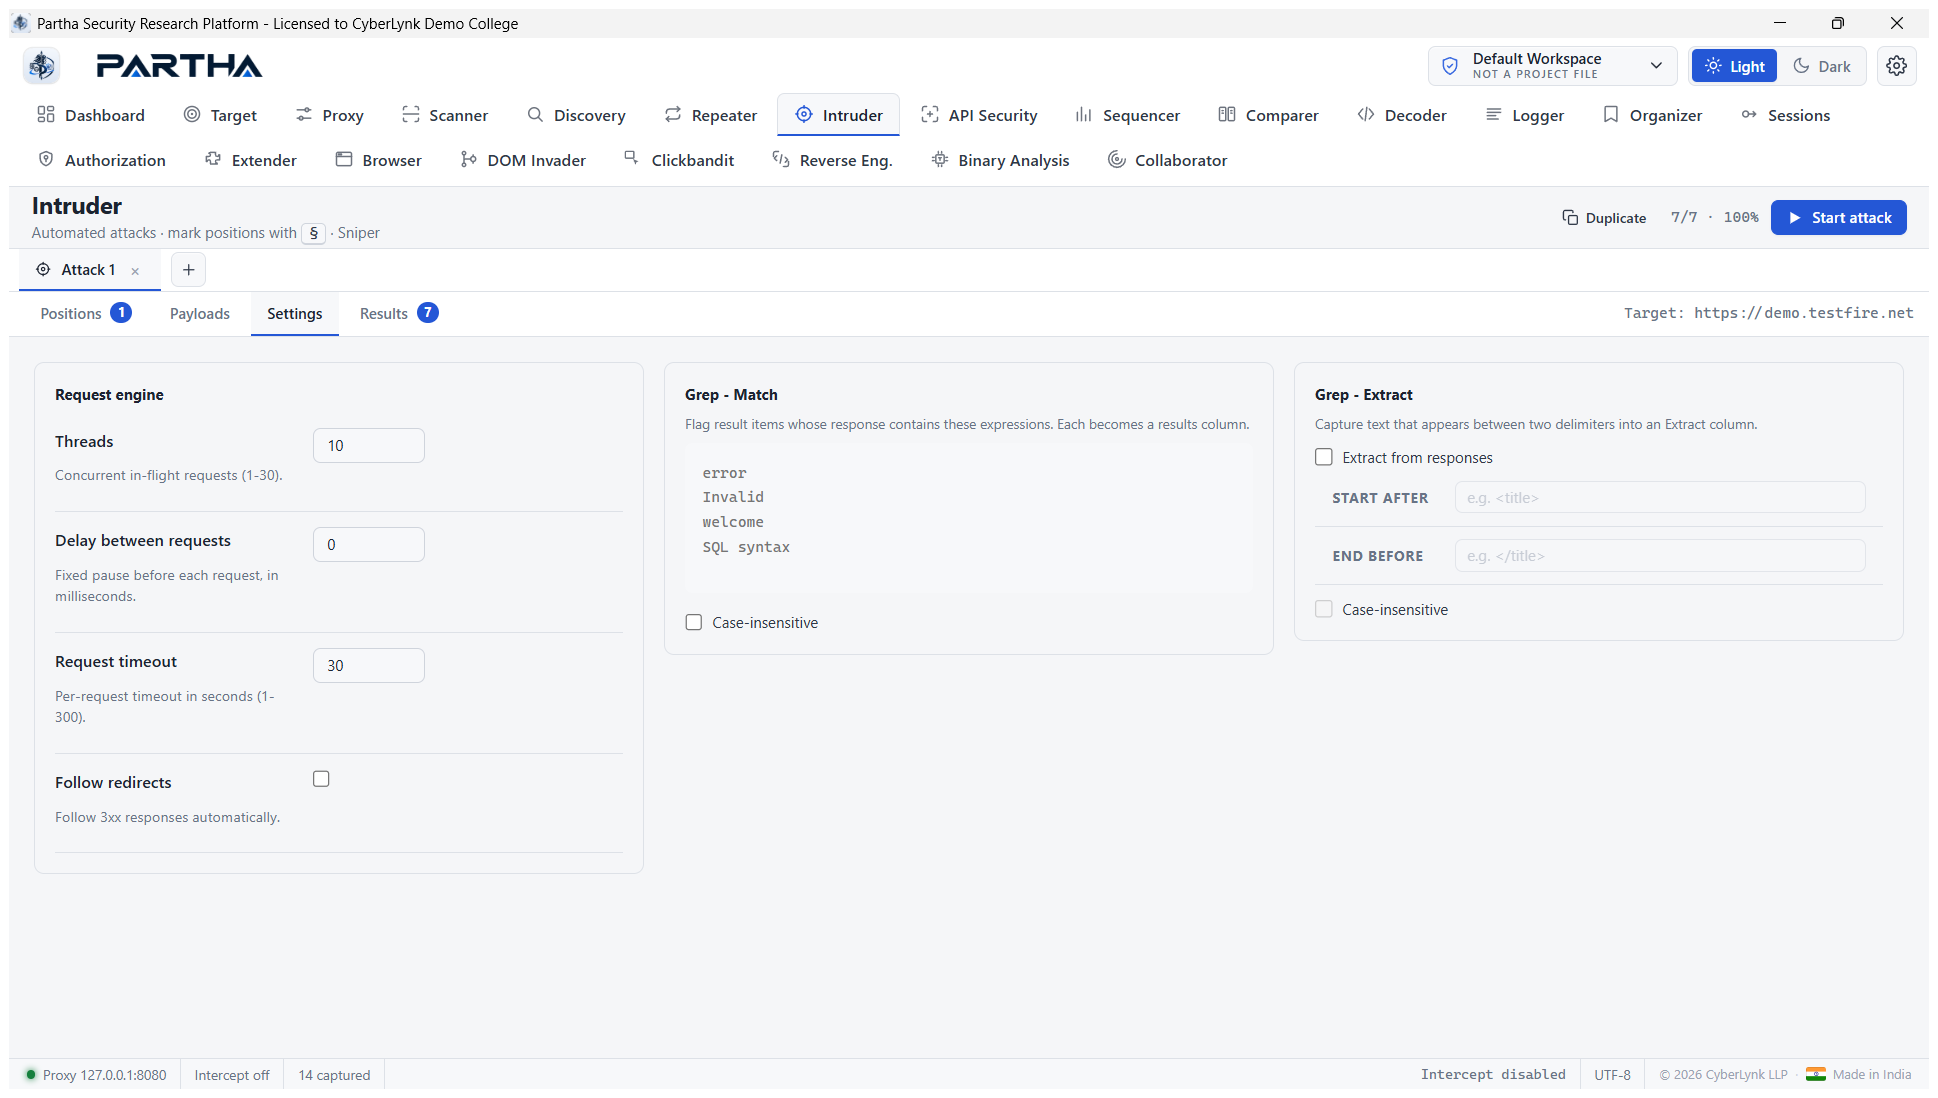
The Settings tab controls the request engine (threads, delay, timeout, follow-redirects) and Grep-Match / Grep-Extract columns:
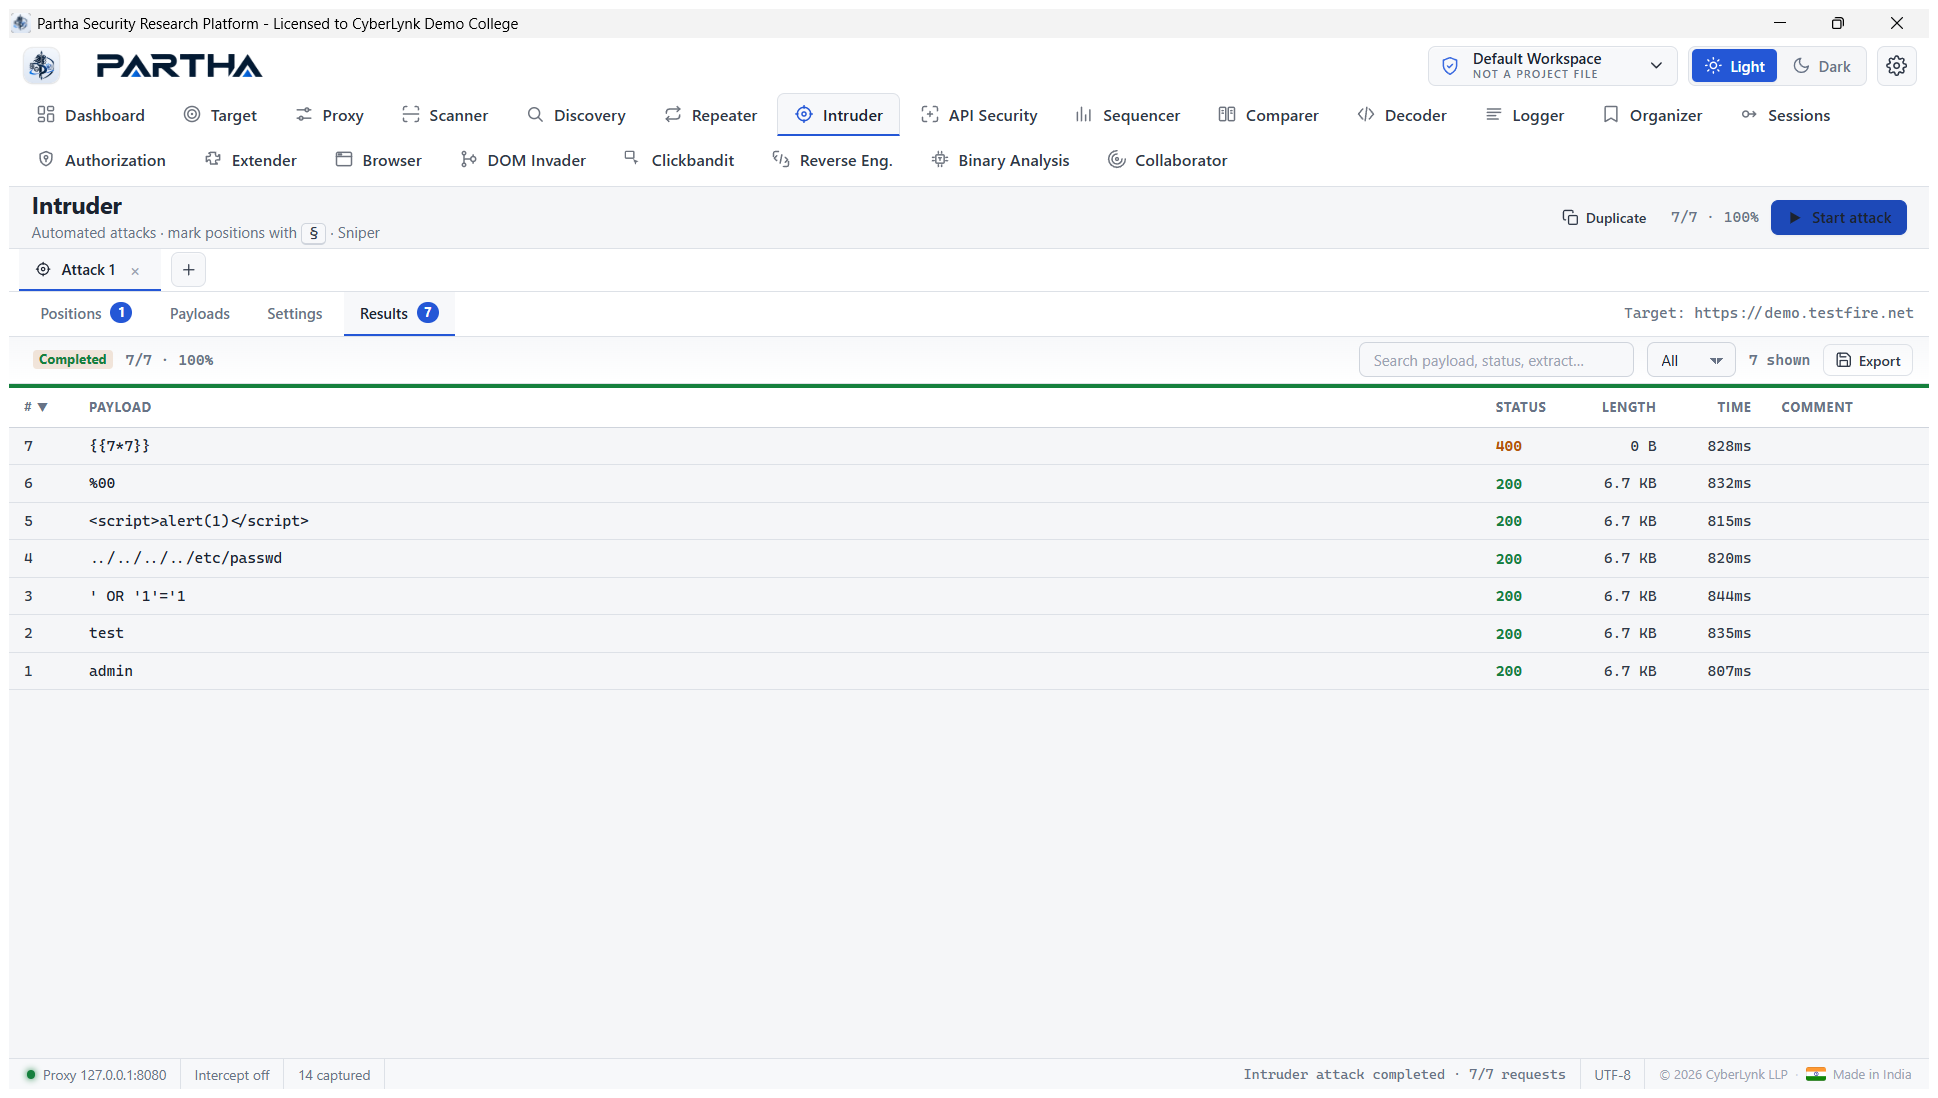
Results — a real run: 7/7 · 100% complete, one row per payload with
status / length / time. The {{7*7}} SSTI probe returned 400 while the others
returned 200; results are searchable, filterable and exportable:
Steps: send a request → Send to Intruder, mark positions (Add §), choose
attack type and payloads, Start attack, and watch results stream into the
Results tab.
6.8 API Security#
Scan OpenAPI, GraphQL and SOAP APIs from a definition file. Partha auto-detects the definition kind and enumerates every operation into a ready-to-send request, then runs an API-focused OWASP audit.
- OpenAPI / Swagger — JSON or YAML, v2 or v3.
- GraphQL — an SDL schema or an introspection JSON result → one
POSTper query/mutation with a real{"query": "…"}body. - SOAP — a WSDL → one
POSTper operation with a ready-to-send SOAP envelope, the rightContent-Type, and theSOAPActionheader.
Import a file, fetch from URL, or paste a document:
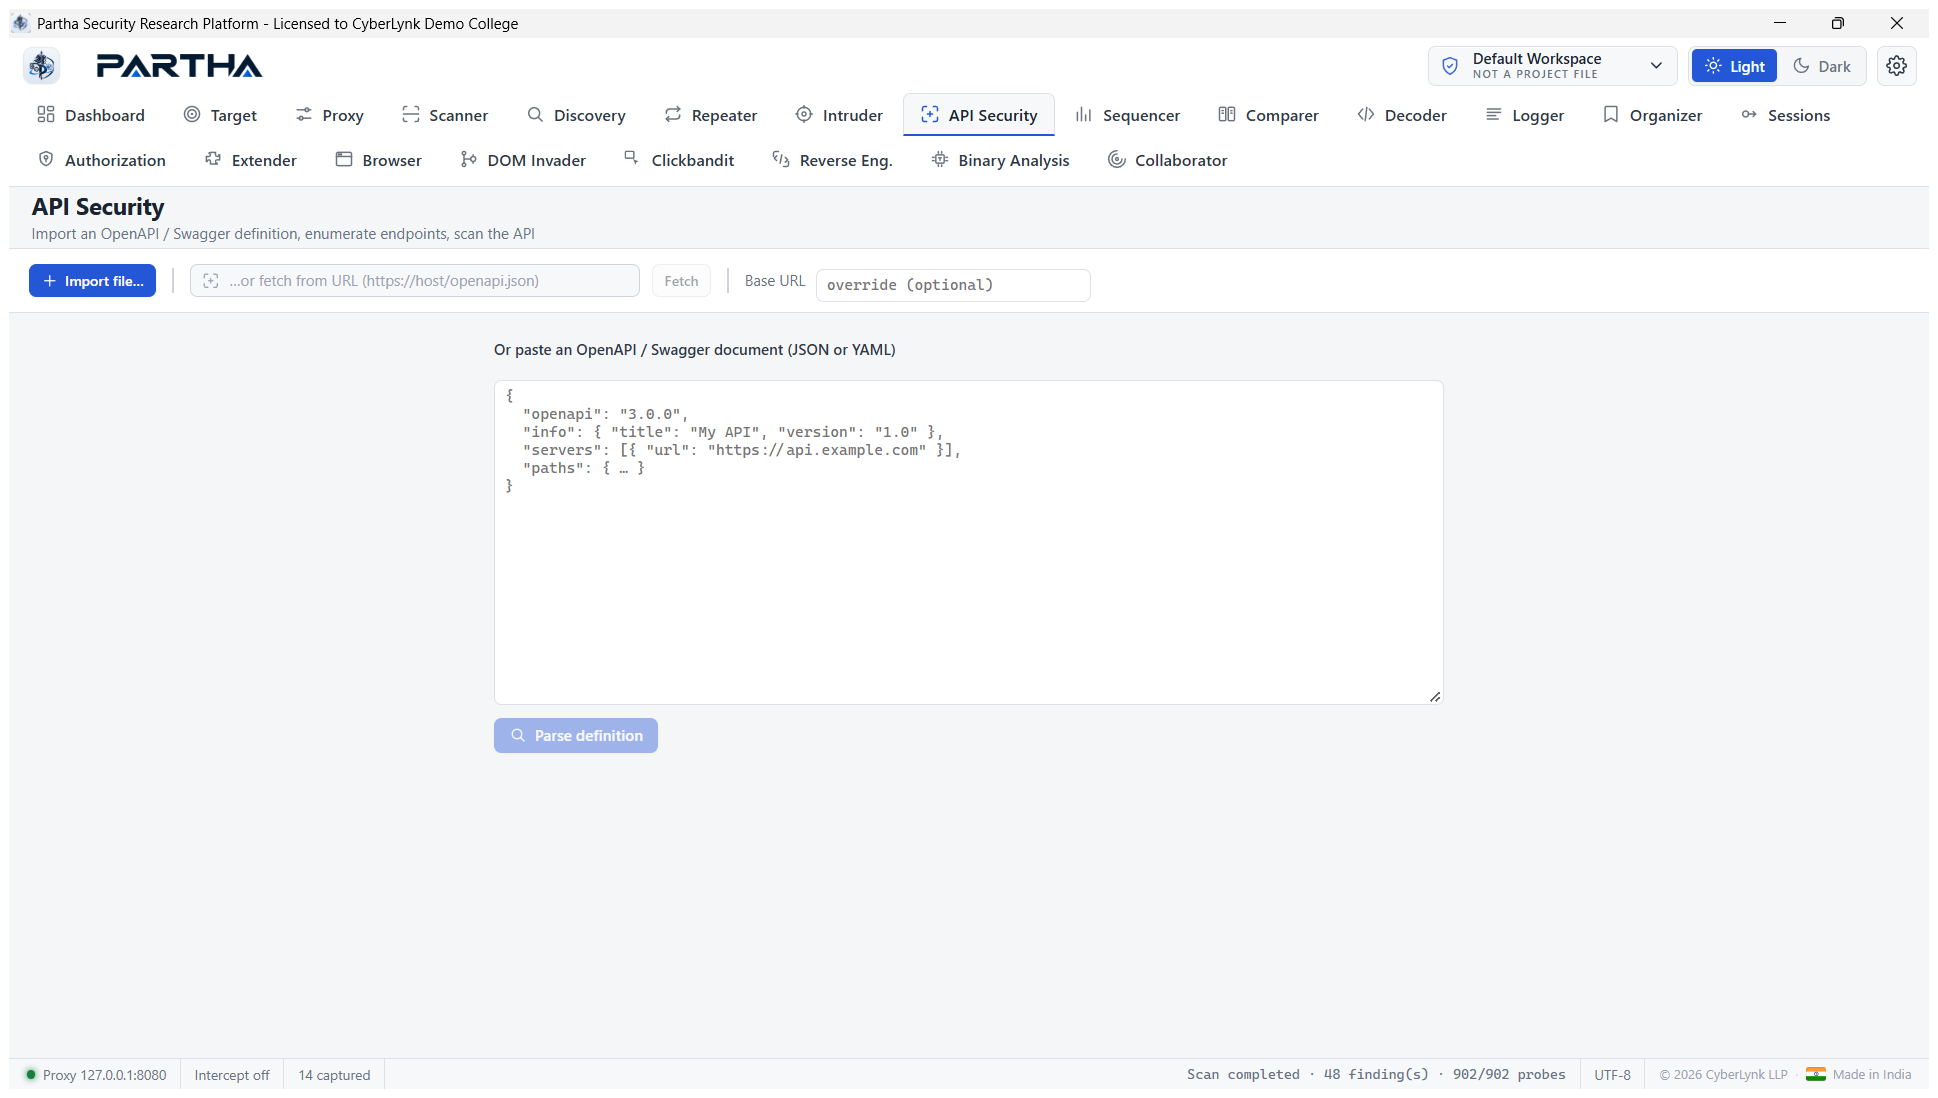
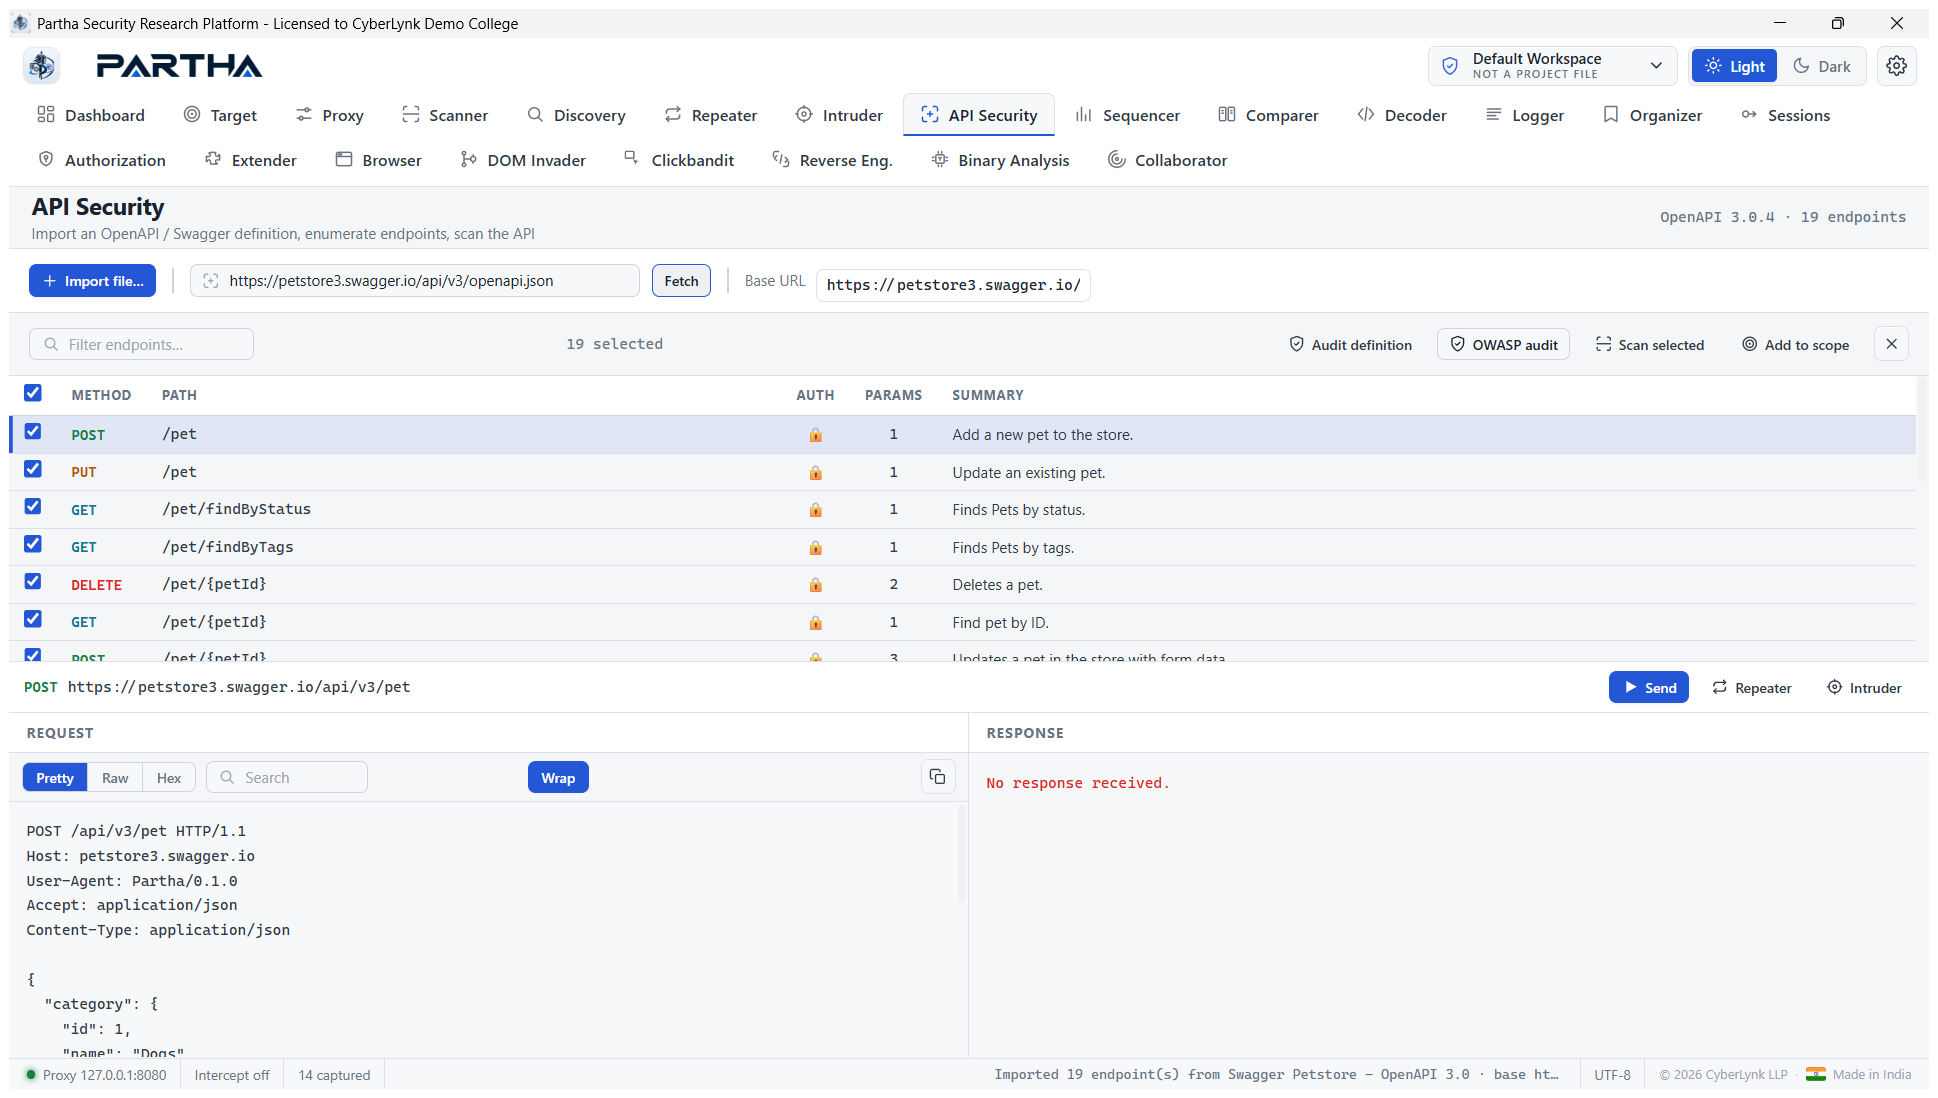
OpenAPI — real result: fetching the live Swagger Petstore spec parsed OpenAPI 3.0.4 · 19 endpoints into ready-to-send requests, with Audit definition, OWASP audit, Scan selected, Add to scope, and a request/response preview:
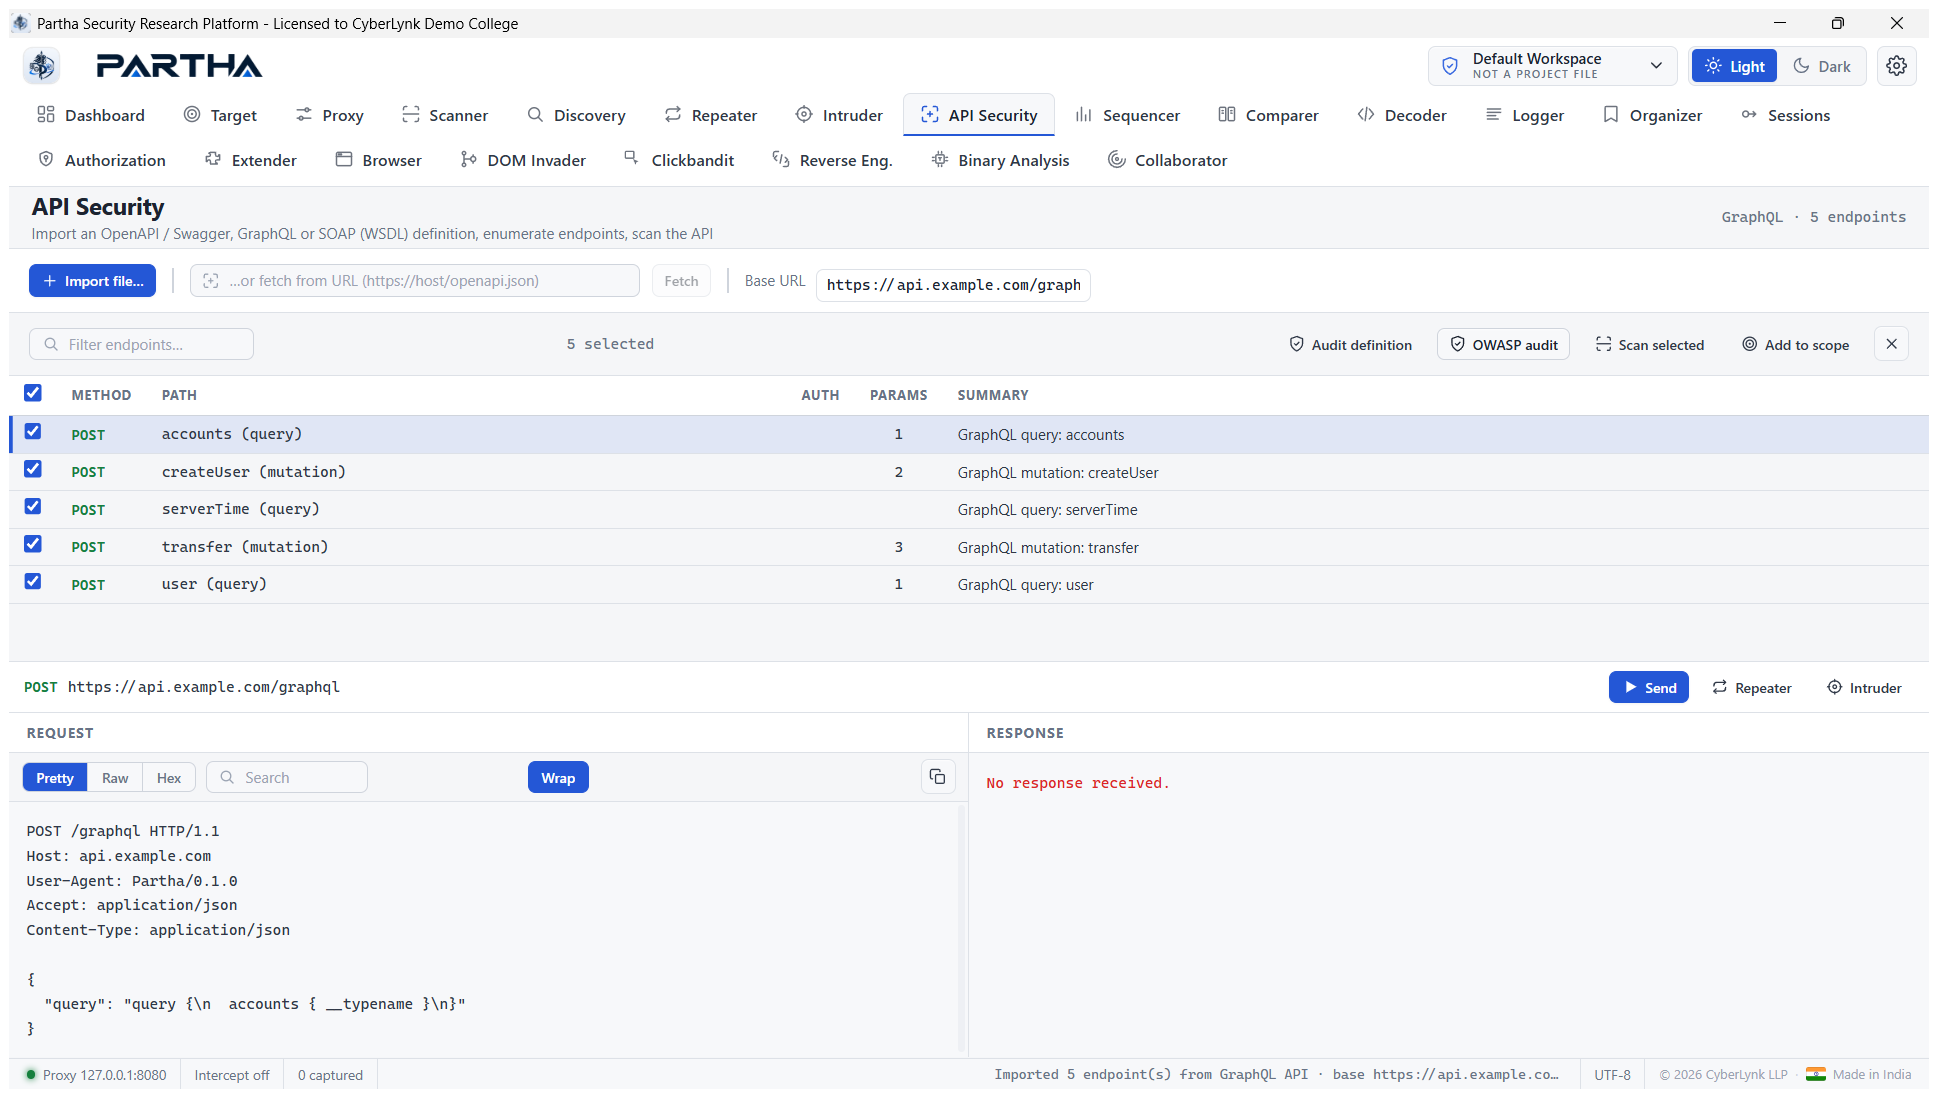
GraphQL — real result: pasting a GraphQL SDL schema (base URL =
https://api.example.com/graphql) enumerated GraphQL · 5 endpoints — every
query and mutation as a POST carrying a valid GraphQL document (note
accounts { __typename } in the generated body; object return types get a
selection set, scalars do not):
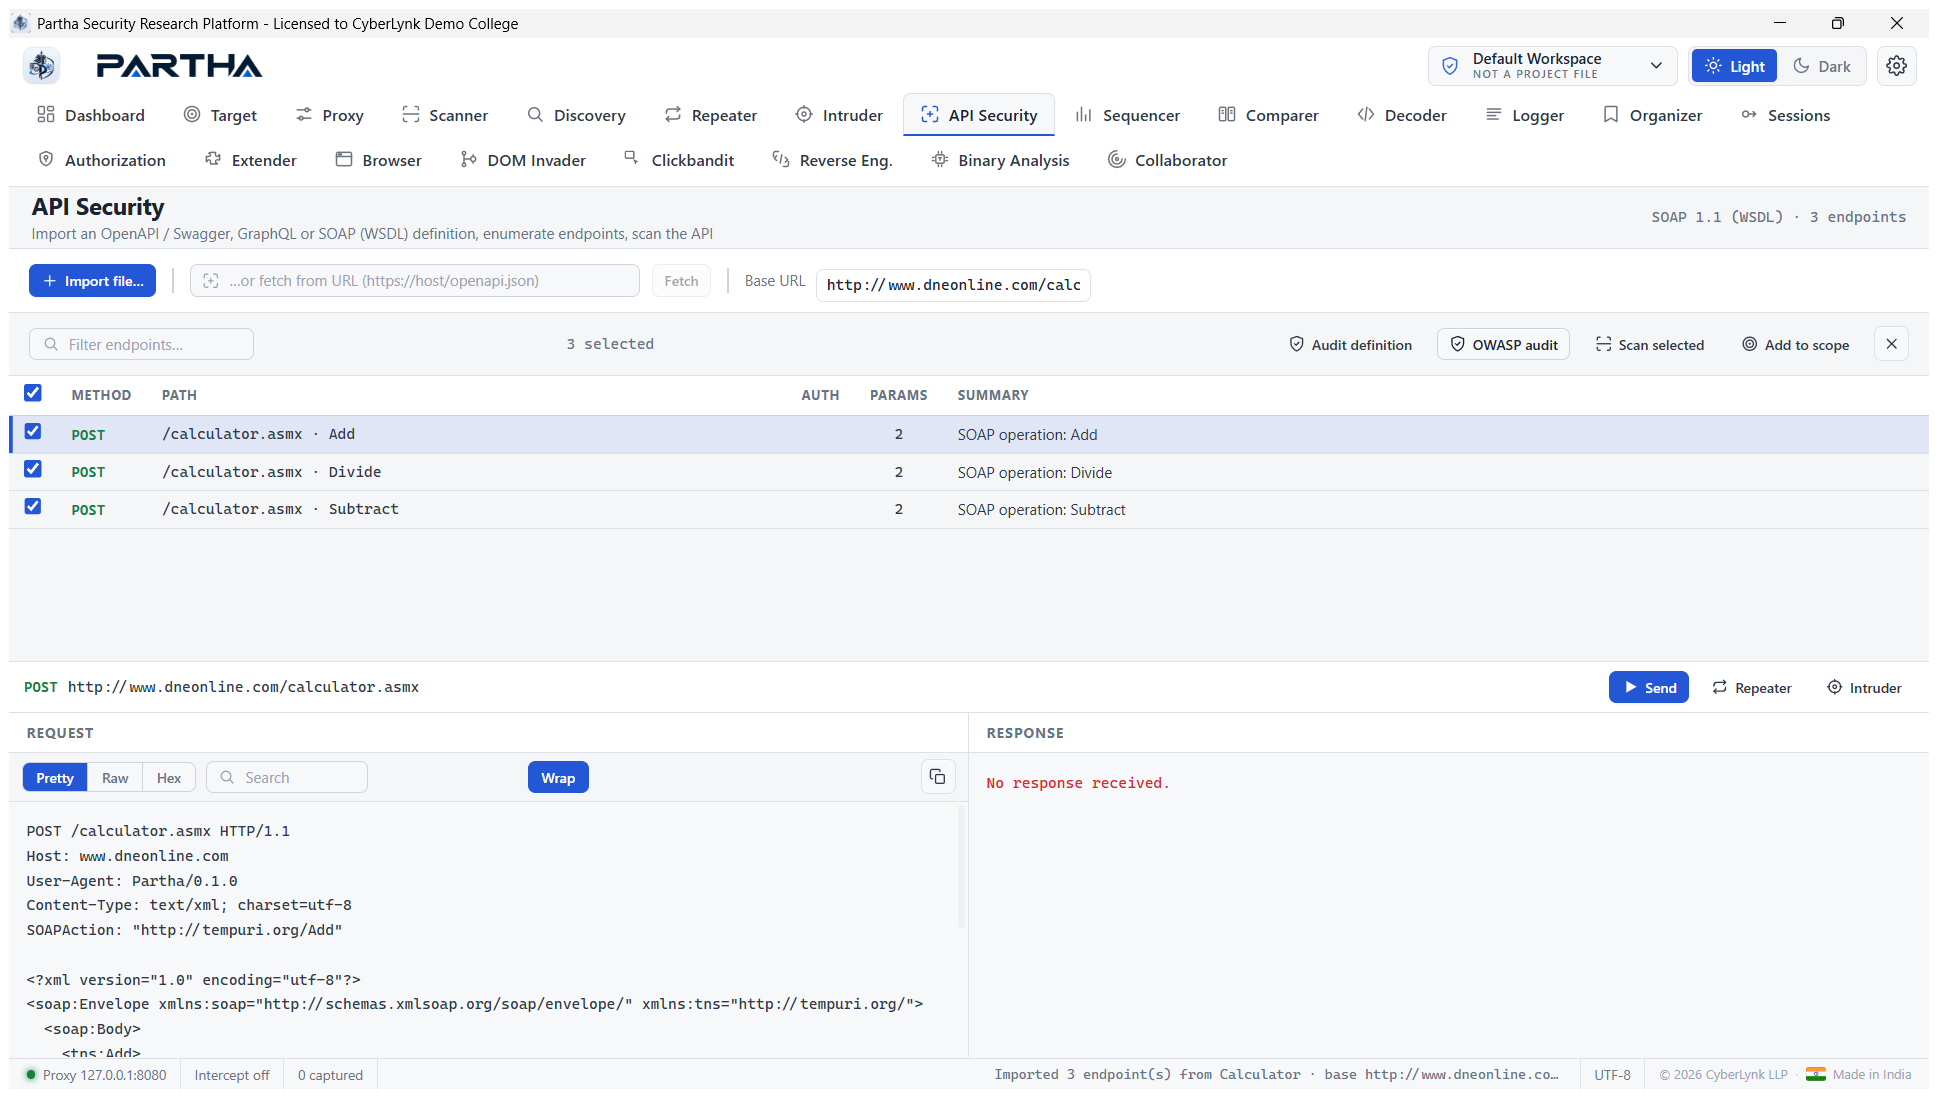
SOAP — real result: pasting a WSDL enumerated SOAP 1.1 (WSDL) · 3
endpoints — each operation as a POST to the service address (auto-read from
<soap:address>), with Content-Type: text/xml, SOAPAction: "http://tempuri.org/Add", and a ready-to-send <soap:Envelope> whose parameters
were extracted from the inline schema:
Steps: paste/import a definition (or type its URL and Fetch); for GraphQL
put the endpoint URL in Base URL (an SDL/introspection doc carries no server)
→ Parse definition → select endpoints → OWASP audit (BOLA, broken auth,
BFLA, mass assignment, CORS misconfig, …) or hand off to Repeater/Intruder. The
Scanner also ships a graphql-introspection check for live GraphQL endpoints.
6.9 Sequencer#
Assess token strength — test the quality of randomness in session tokens.
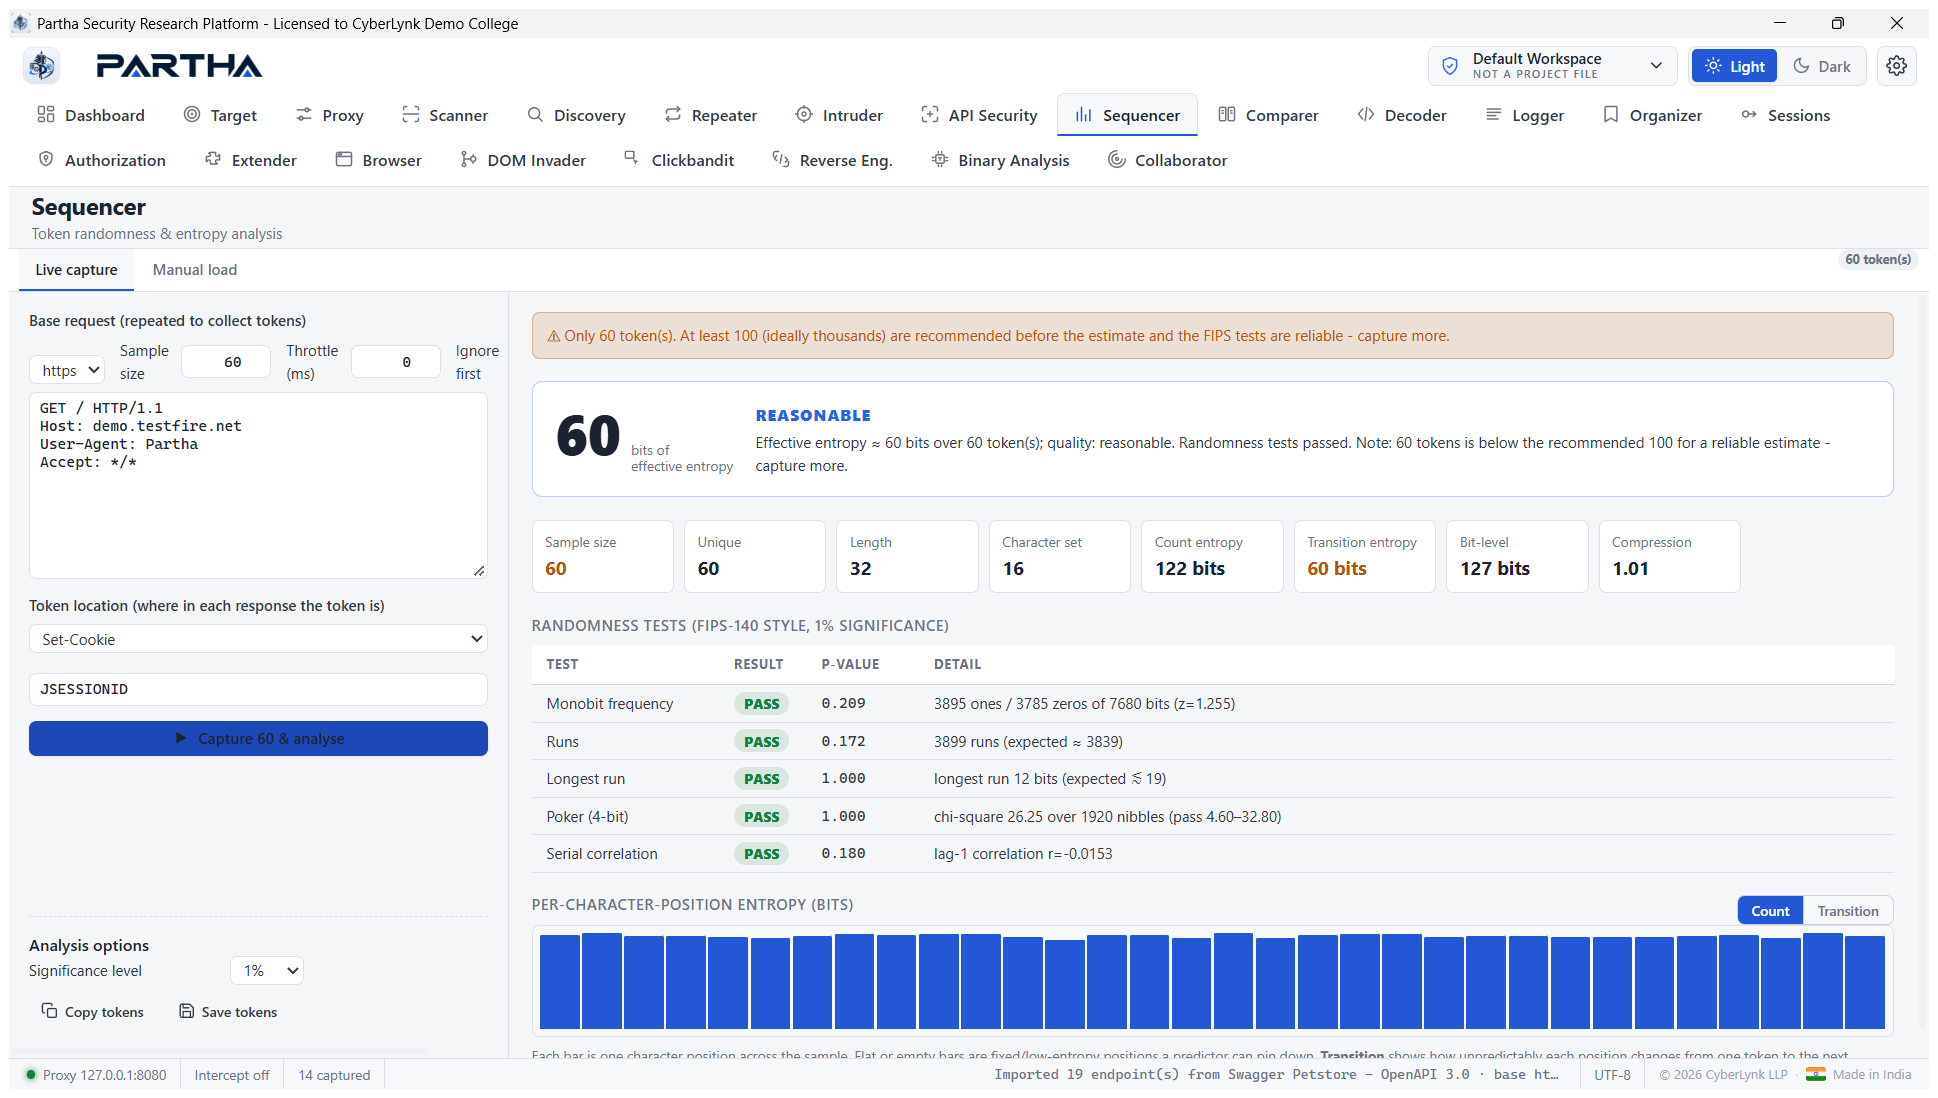
Real result — capturing 60 JSESSIONID cookies from demo.testfire.net
yielded ≈60 bits of effective entropy ("REASONABLE") with all five FIPS-140
randomness tests PASS (monobit, runs, longest-run, poker, serial
correlation), plus per-character entropy and a compression check:
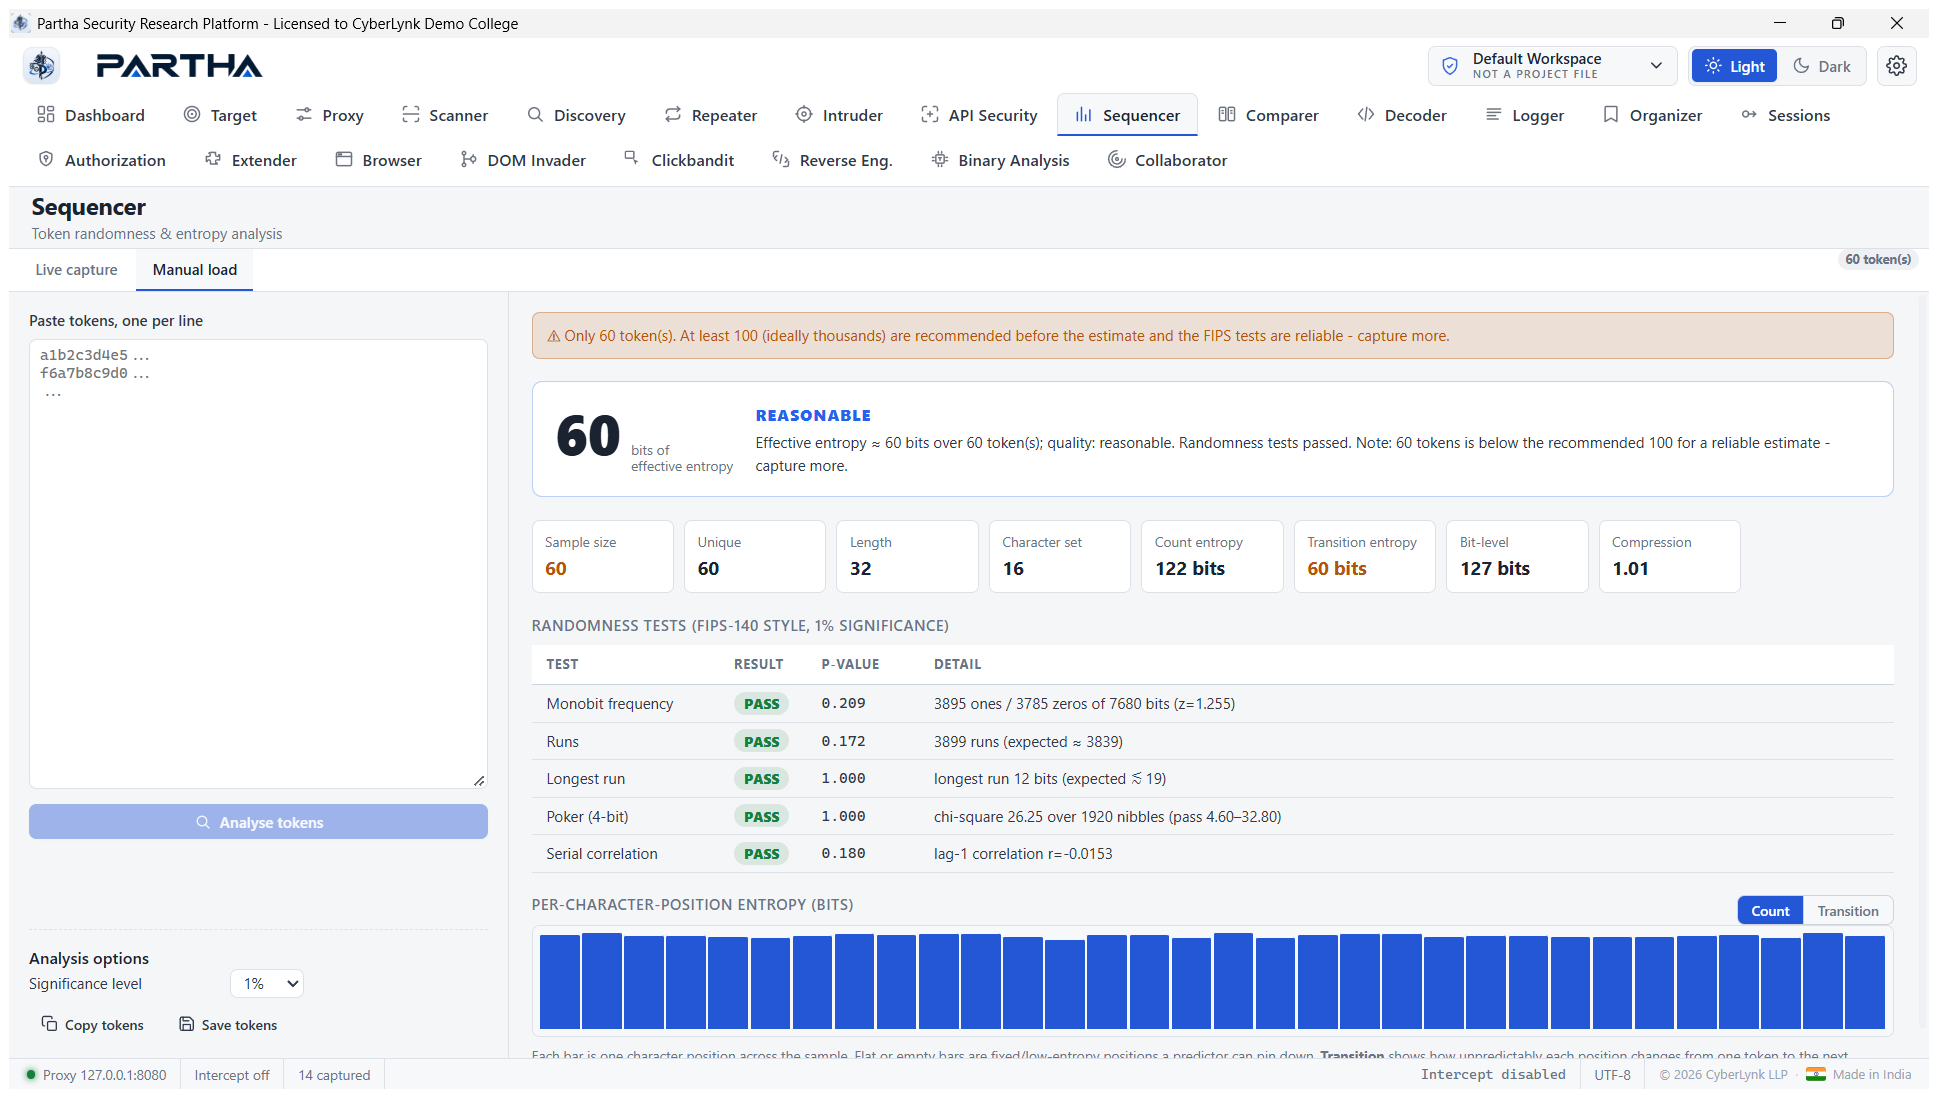
The Manual load tab analyses a set of tokens you paste directly (same statistics, no capture):
Steps: on Live capture, paste a base request, set Sample size, Throttle, Ignore first, choose the Token location (Set-Cookie / header / body delimiters / regex) and the cookie/token name, then Capture & analyse. Aim for 100+ tokens for a reliable estimate.
6.10 Comparer#
Word- and byte-level diff of two items, with security insights.
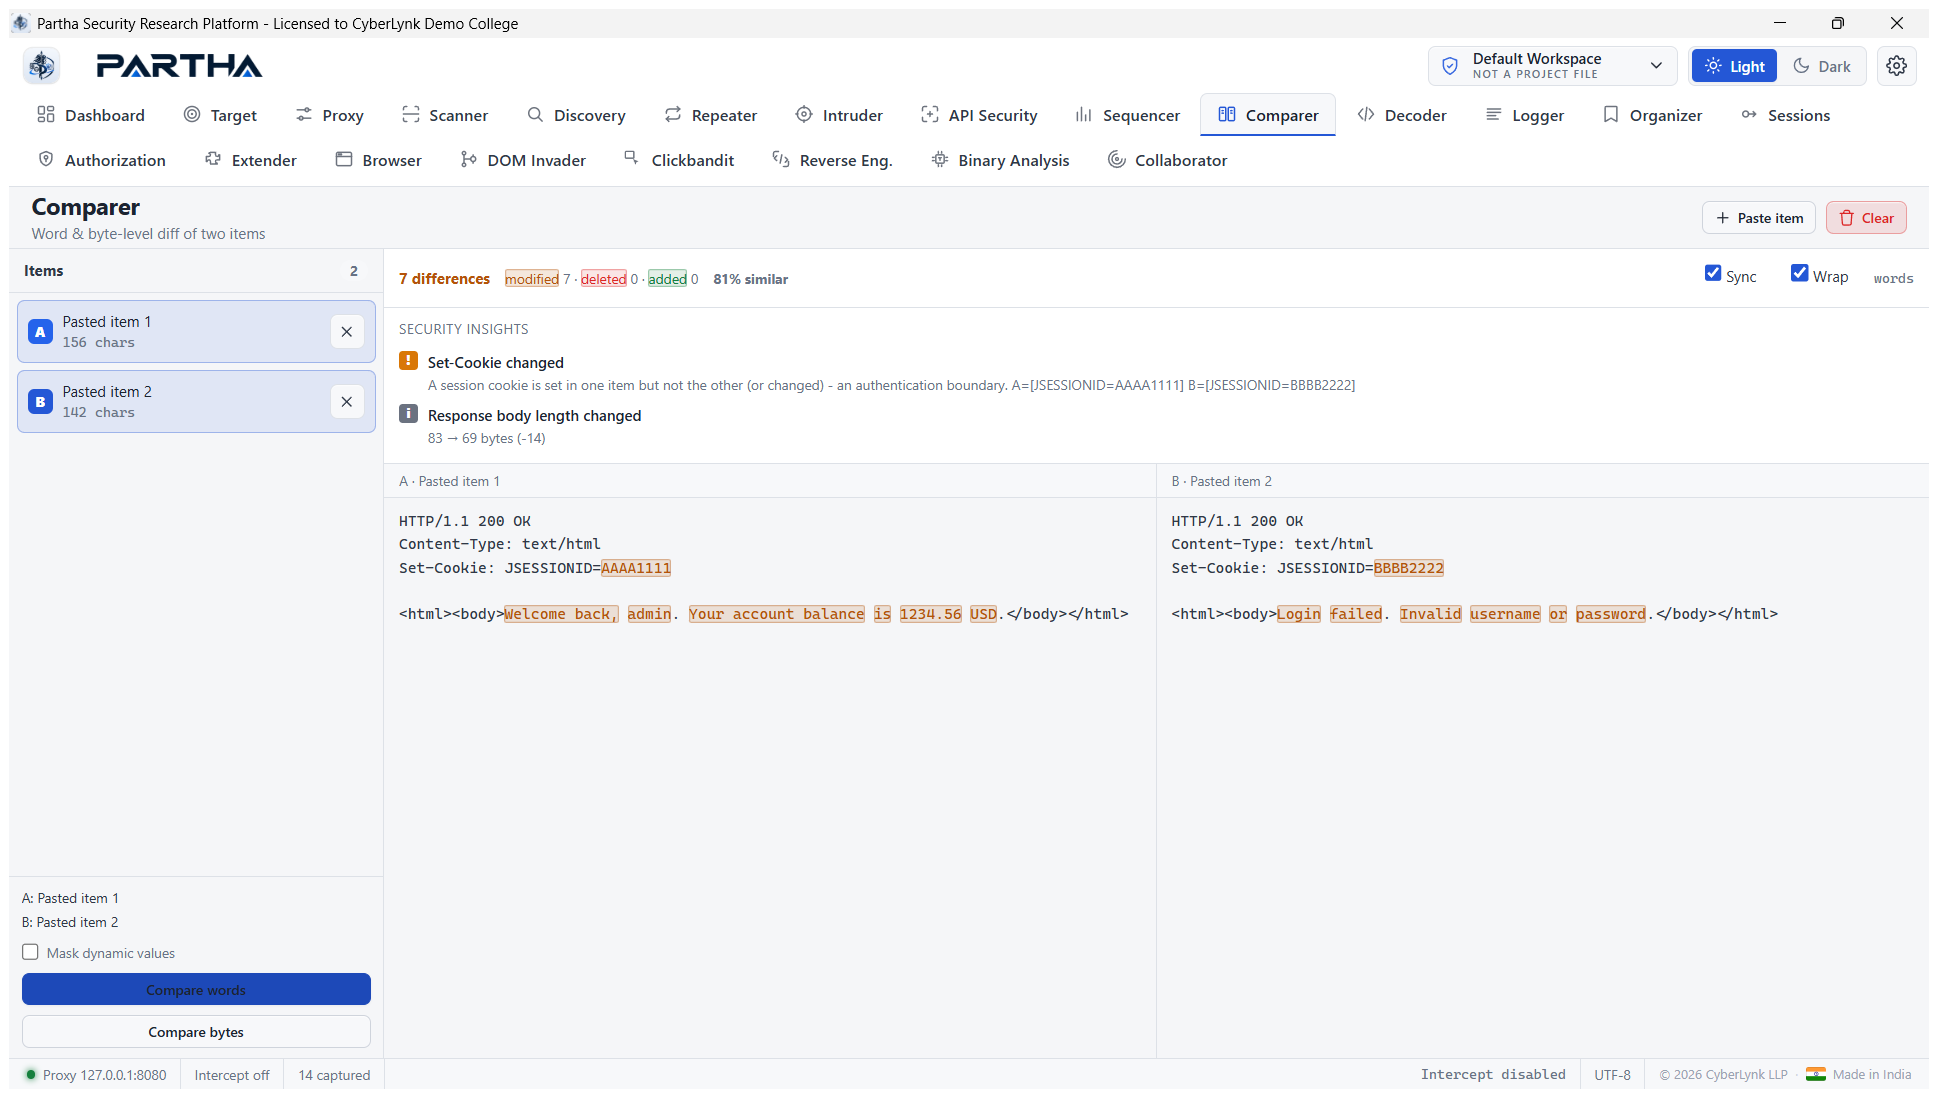
Real result — diffing two HTTP responses shows 7 differences, 81% similar, with Security Insights flagging the Set-Cookie change (an authentication boundary) and the body-length delta, and the changed words highlighted side by side:
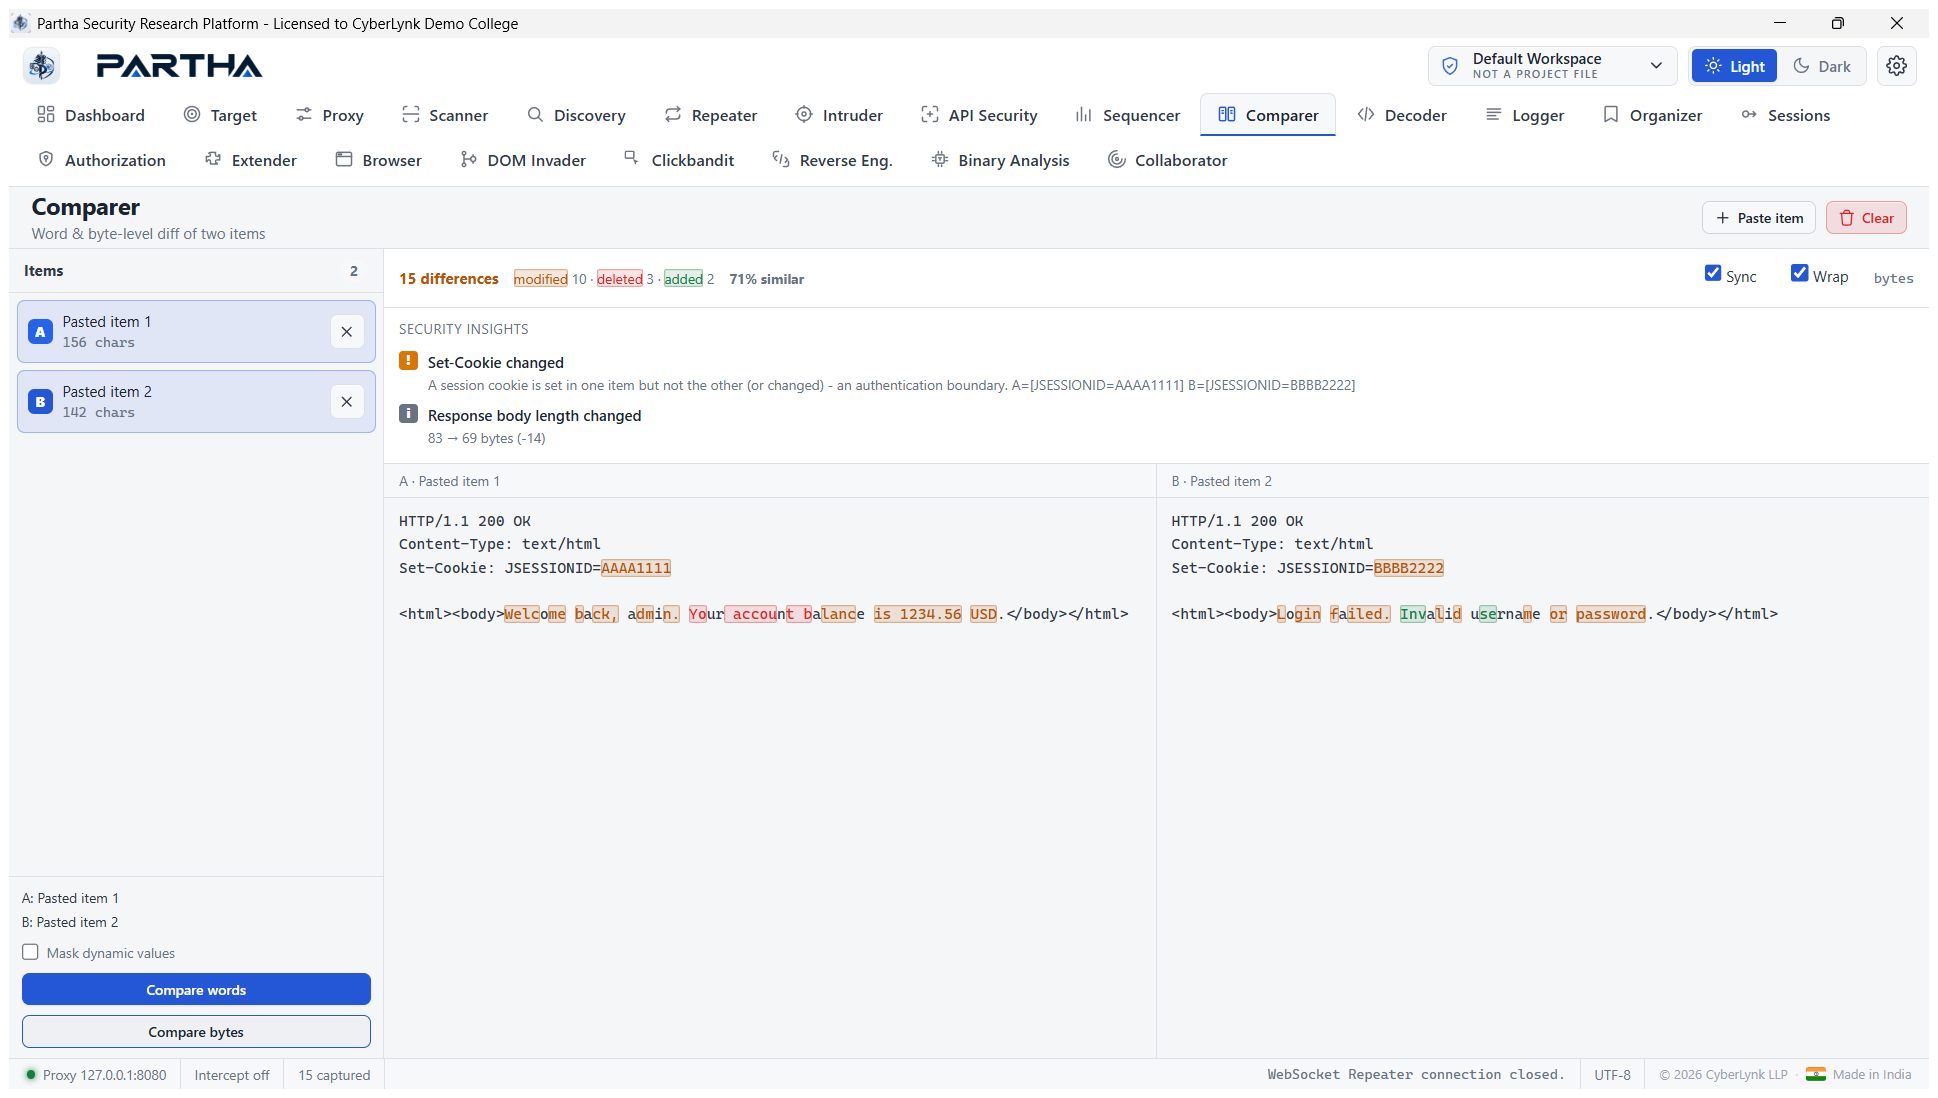
Compare bytes does a finer byte-level diff of the same two items — here 15 differences, 71% similar, with individual character runs highlighted:
Steps: add two items (Paste item, or Send to Comparer from an inspector/context menu), select A and B, then Compare words or Compare bytes. Optional Mask dynamic values normalizes timestamps/UUIDs before diffing.
6.11 Decoder#
Transform data with a stackable chain of encoders/decoders and hashes.
Real result — Smart decode on the URL-encoded XSS payload seen on the
target (%3Cscript%3Ealert(document.cookie)%3C%2Fscript%3E) auto-detected URL
encoding and peeled it to <script>alert(document.cookie)</script>:
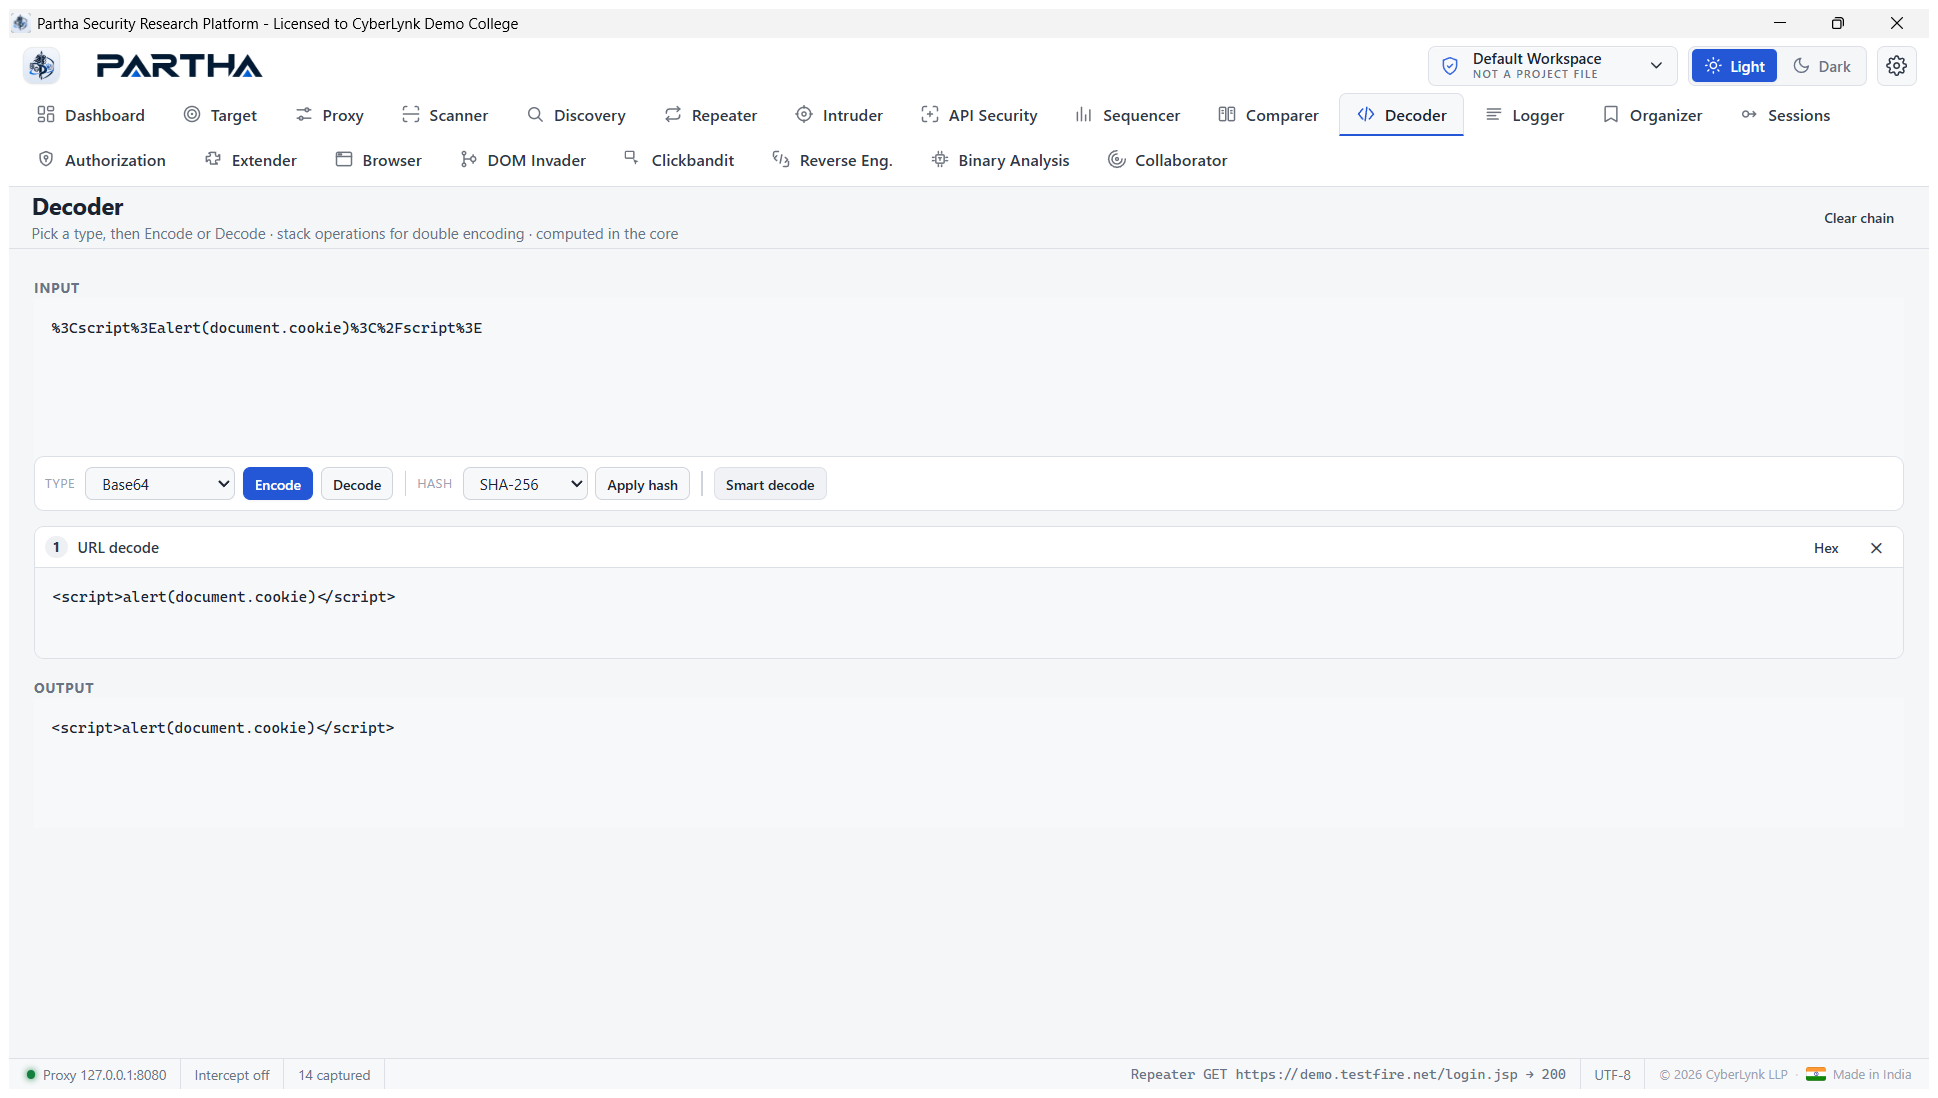
Steps: paste a value; pick a type (URL, HTML, Base64, Base64URL, Hex, gzip, deflate) and Encode/Decode — each op feeds the next, so click again to double-encode. Hash (MD5/SHA-1/SHA-256/384/512) and Smart decode (peel one layer automatically) are one click away.
6.12 Logger#
Every tool's traffic in one filterable, sortable, searchable log, each row tagged with its source (Proxy / Repeater / Intruder / Scanner / Crawler).
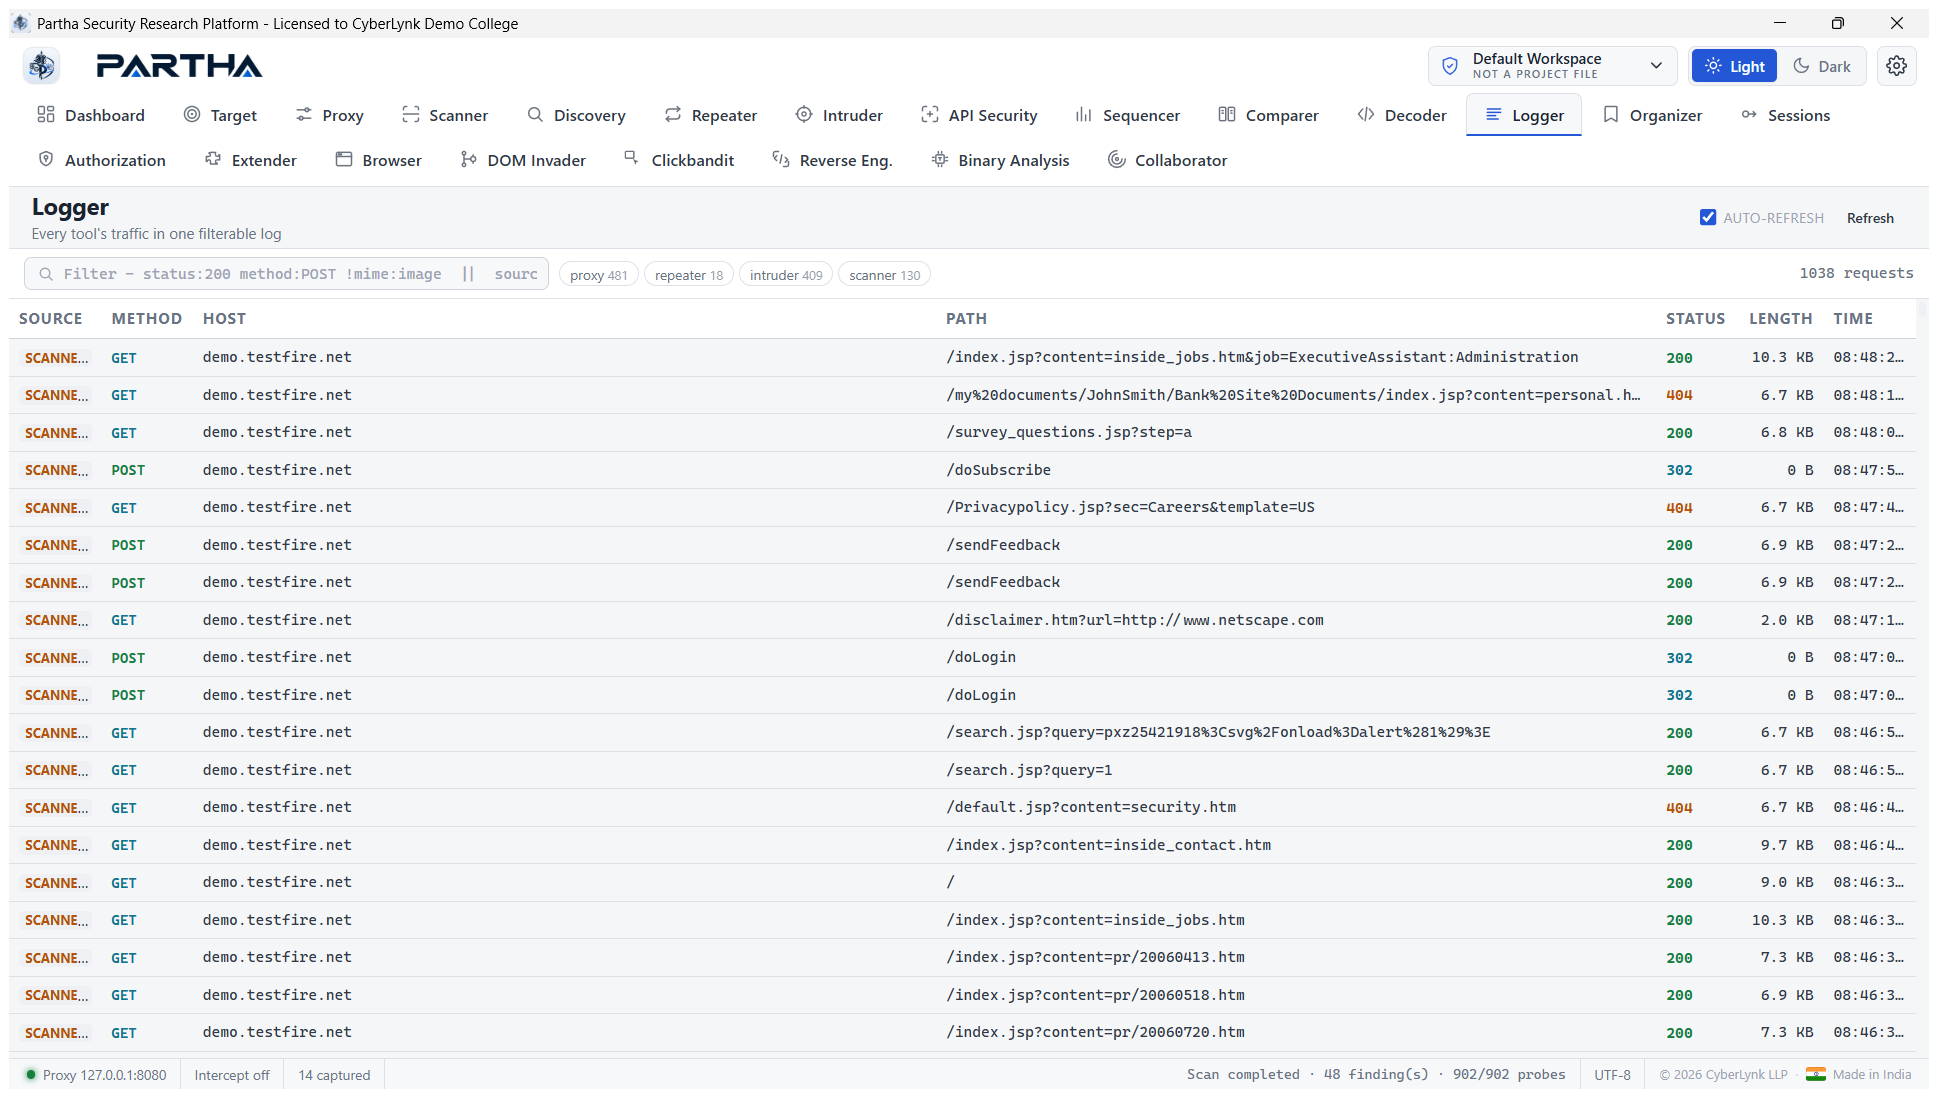
Real result — applying the Bambda-style filter
source:scanner status:200 method:GET narrowed 1046 → 105 requests
instantly; source chips filter with one click:
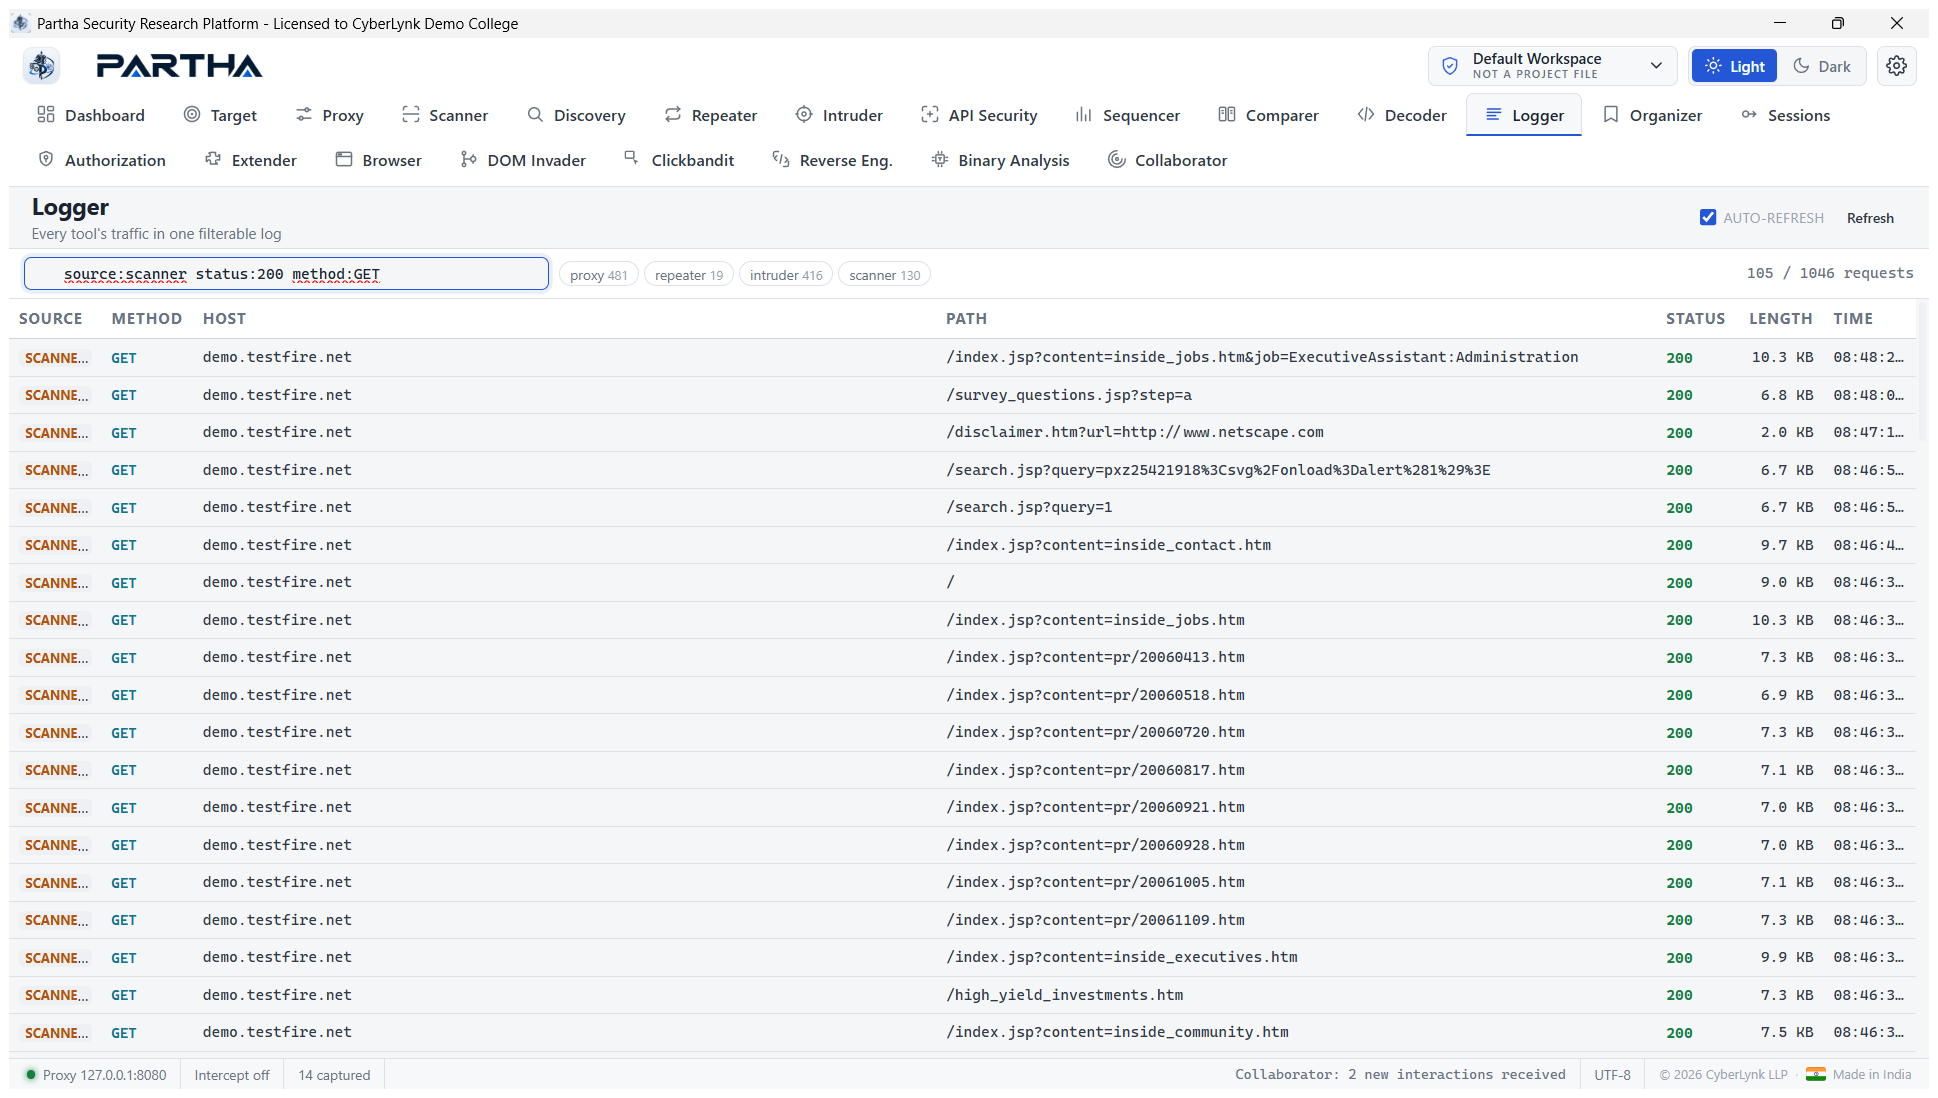
Steps: type a filter (status:, method:, host:, path:, mime:,
source:, len><, !, ||) or click a source chip; auto-refresh keeps it live.
6.13 Organizer#
Store and annotate interesting messages — park any request with a note and a workflow status.
Real result — a testfire request parked from the Proxy context menu, shown with a todo status and a Notes field:
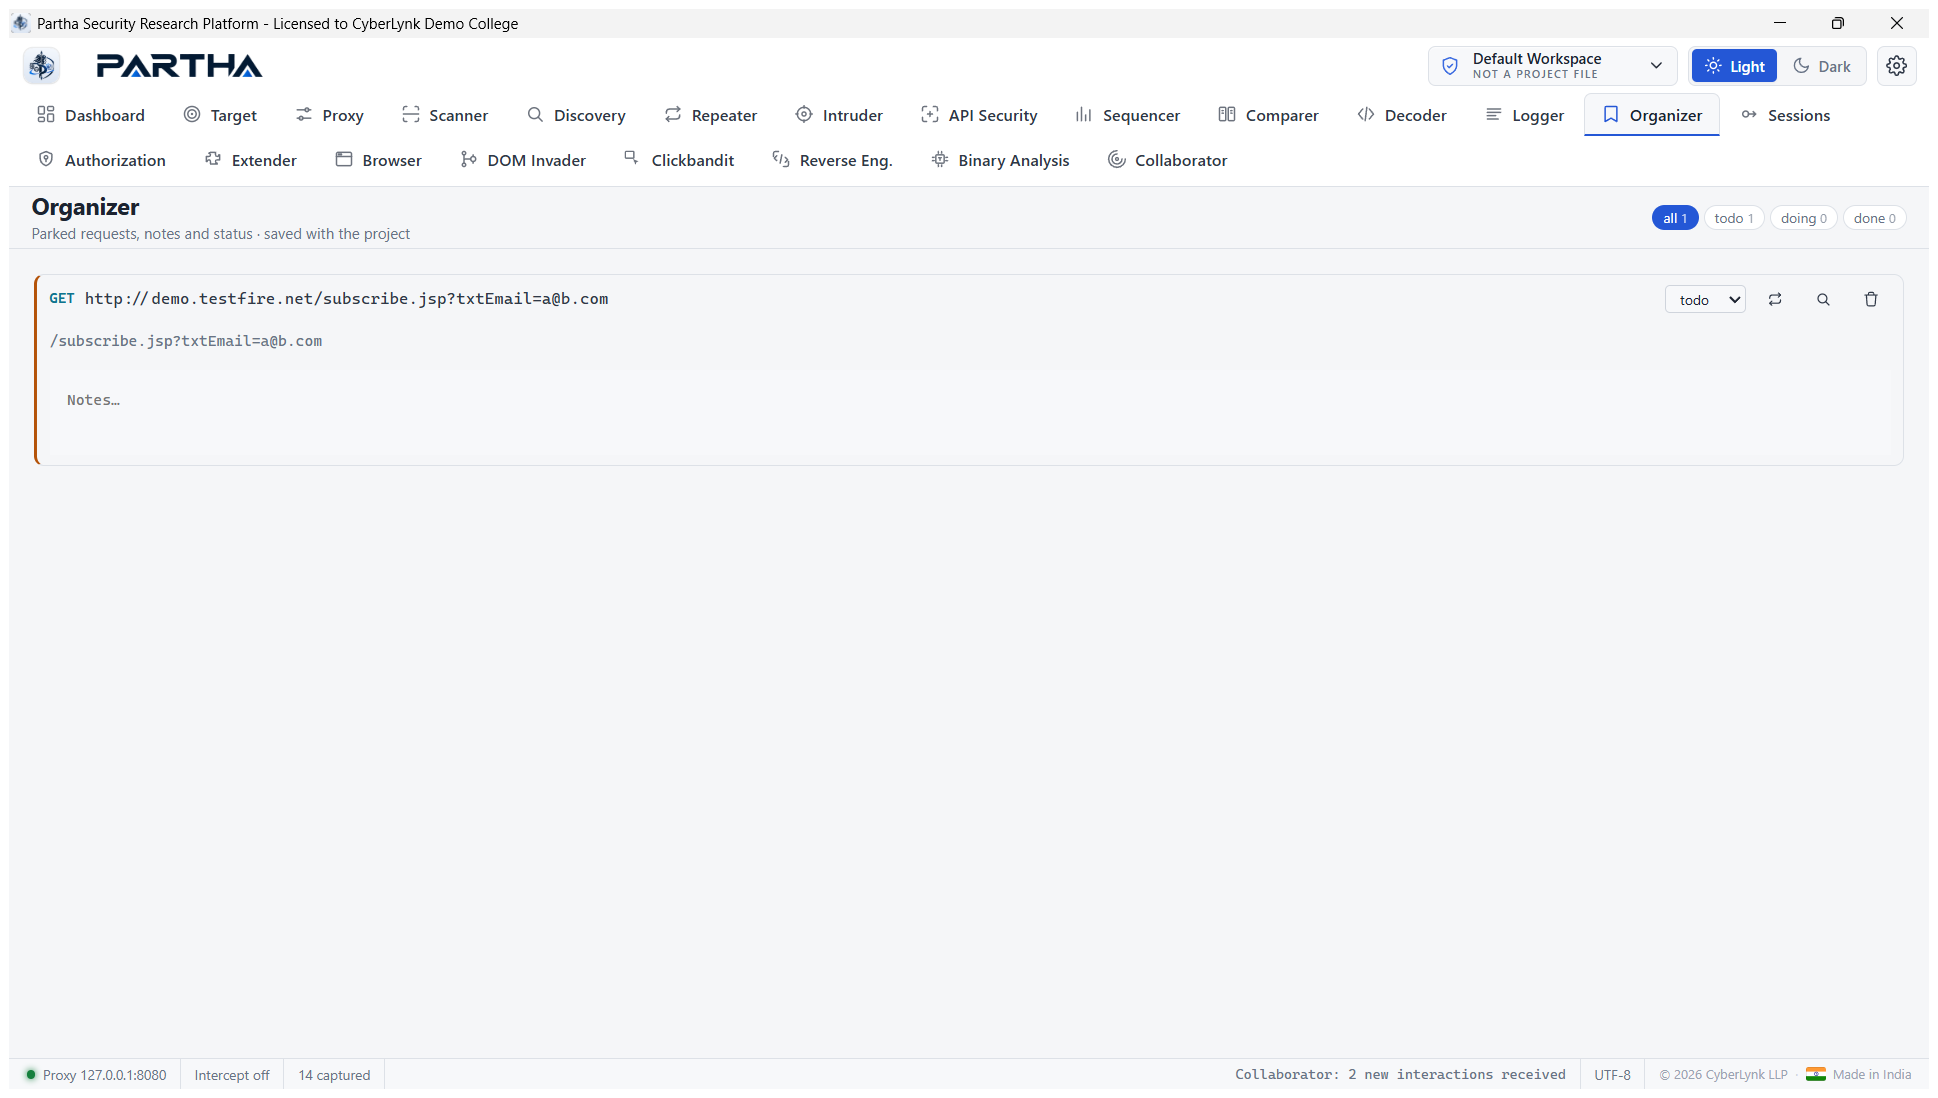
Steps: from the Proxy/Target/Repeater or a finding, choose Send to Organizer (§7). Items are saved with the project and filter by status (all / todo / doing / done).
6.14 Sessions#
Authenticated testing via a login macro whose captured session is injected into proxied traffic.
Real result — a testfire request added as macro step 1 via the Proxy context menu; Run macro (1) executes it and captures the session cookies:
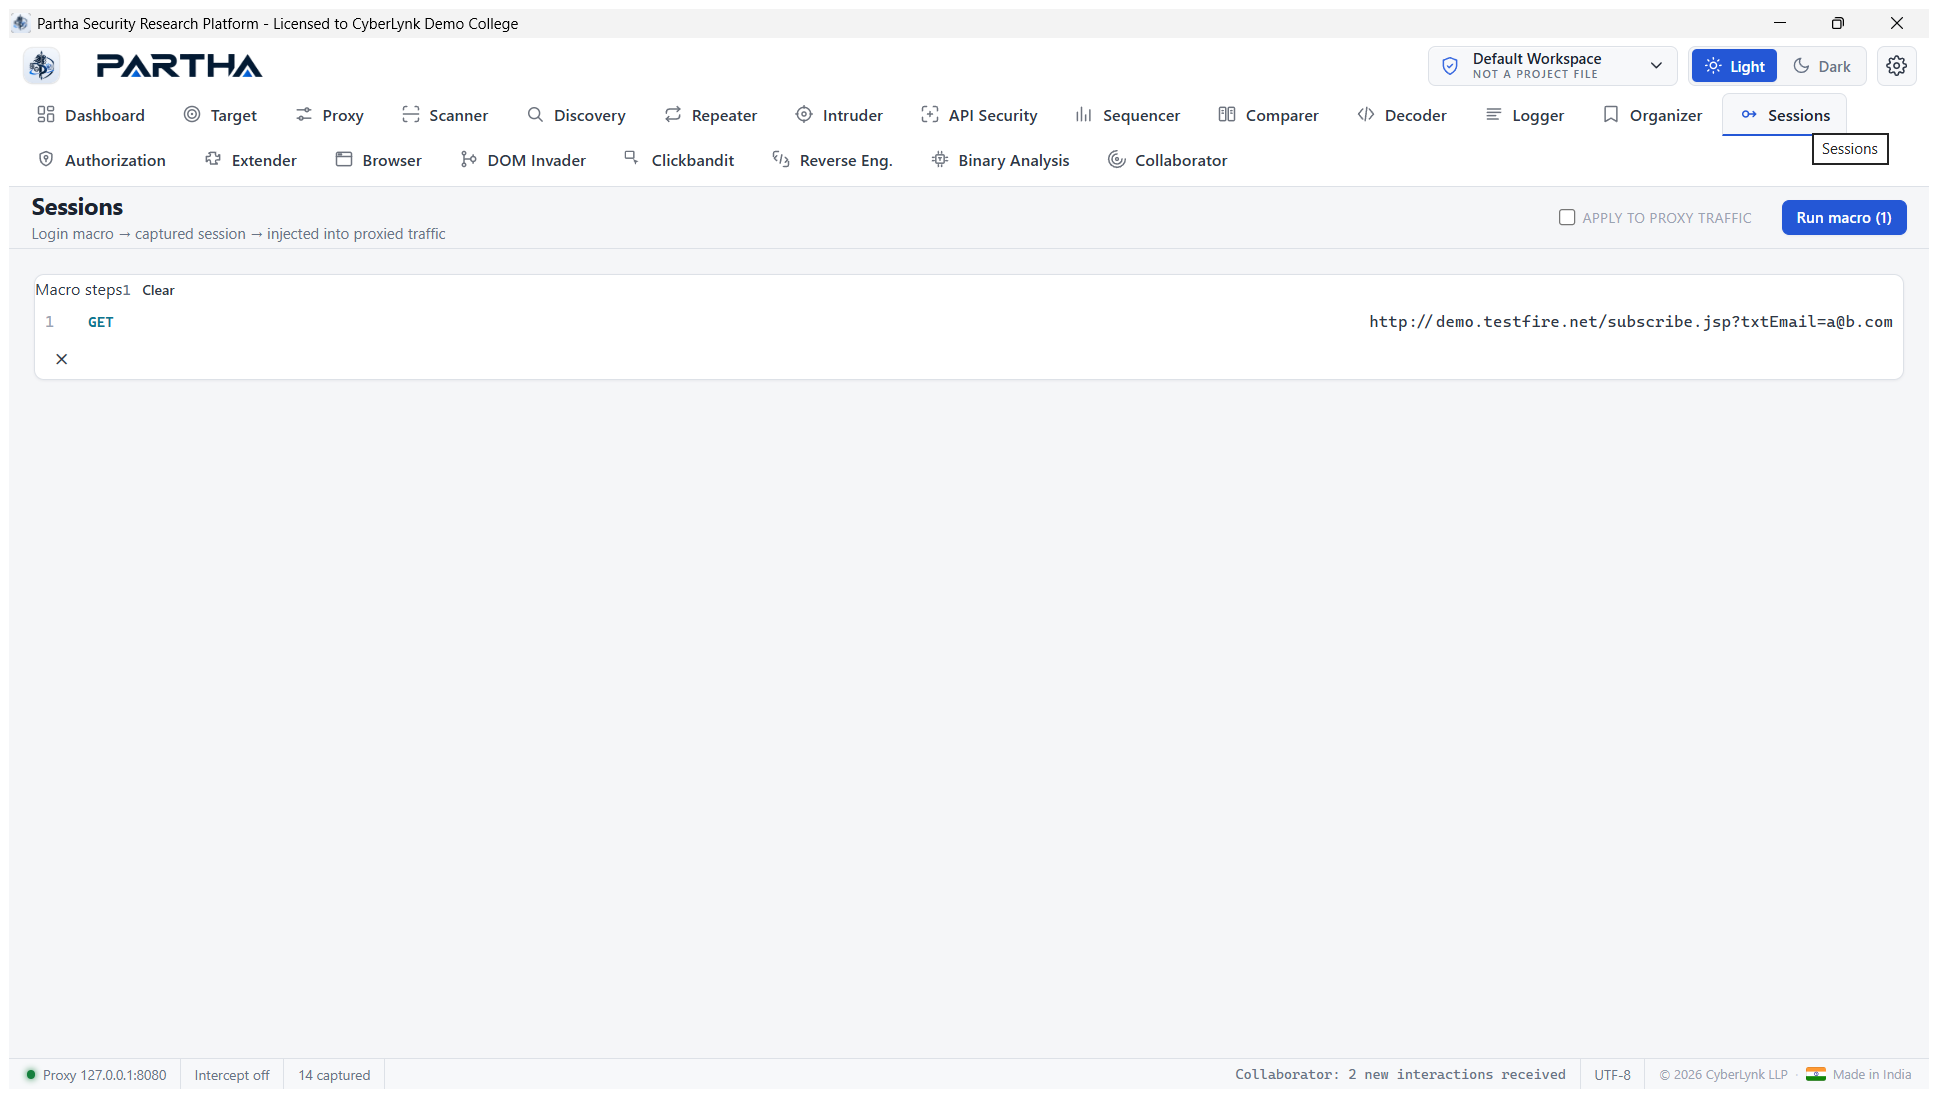
Steps: Send to Session on your login request(s) in order → Run to capture the session → toggle Apply to proxy traffic so Partha carries the authenticated session into all traffic (Scanner/Repeater/Intruder then test as a logged-in user).
6.15 Authorization#
Access-control testing — replay every request as each identity and grade the result automatically (a broken-access-control matrix).
Real result — three protected testfire URLs replayed as user and anonymous: every cell is ENFORCED (302 redirect to login), 0 BYPASSES — the correct verdict for testfire's access control:
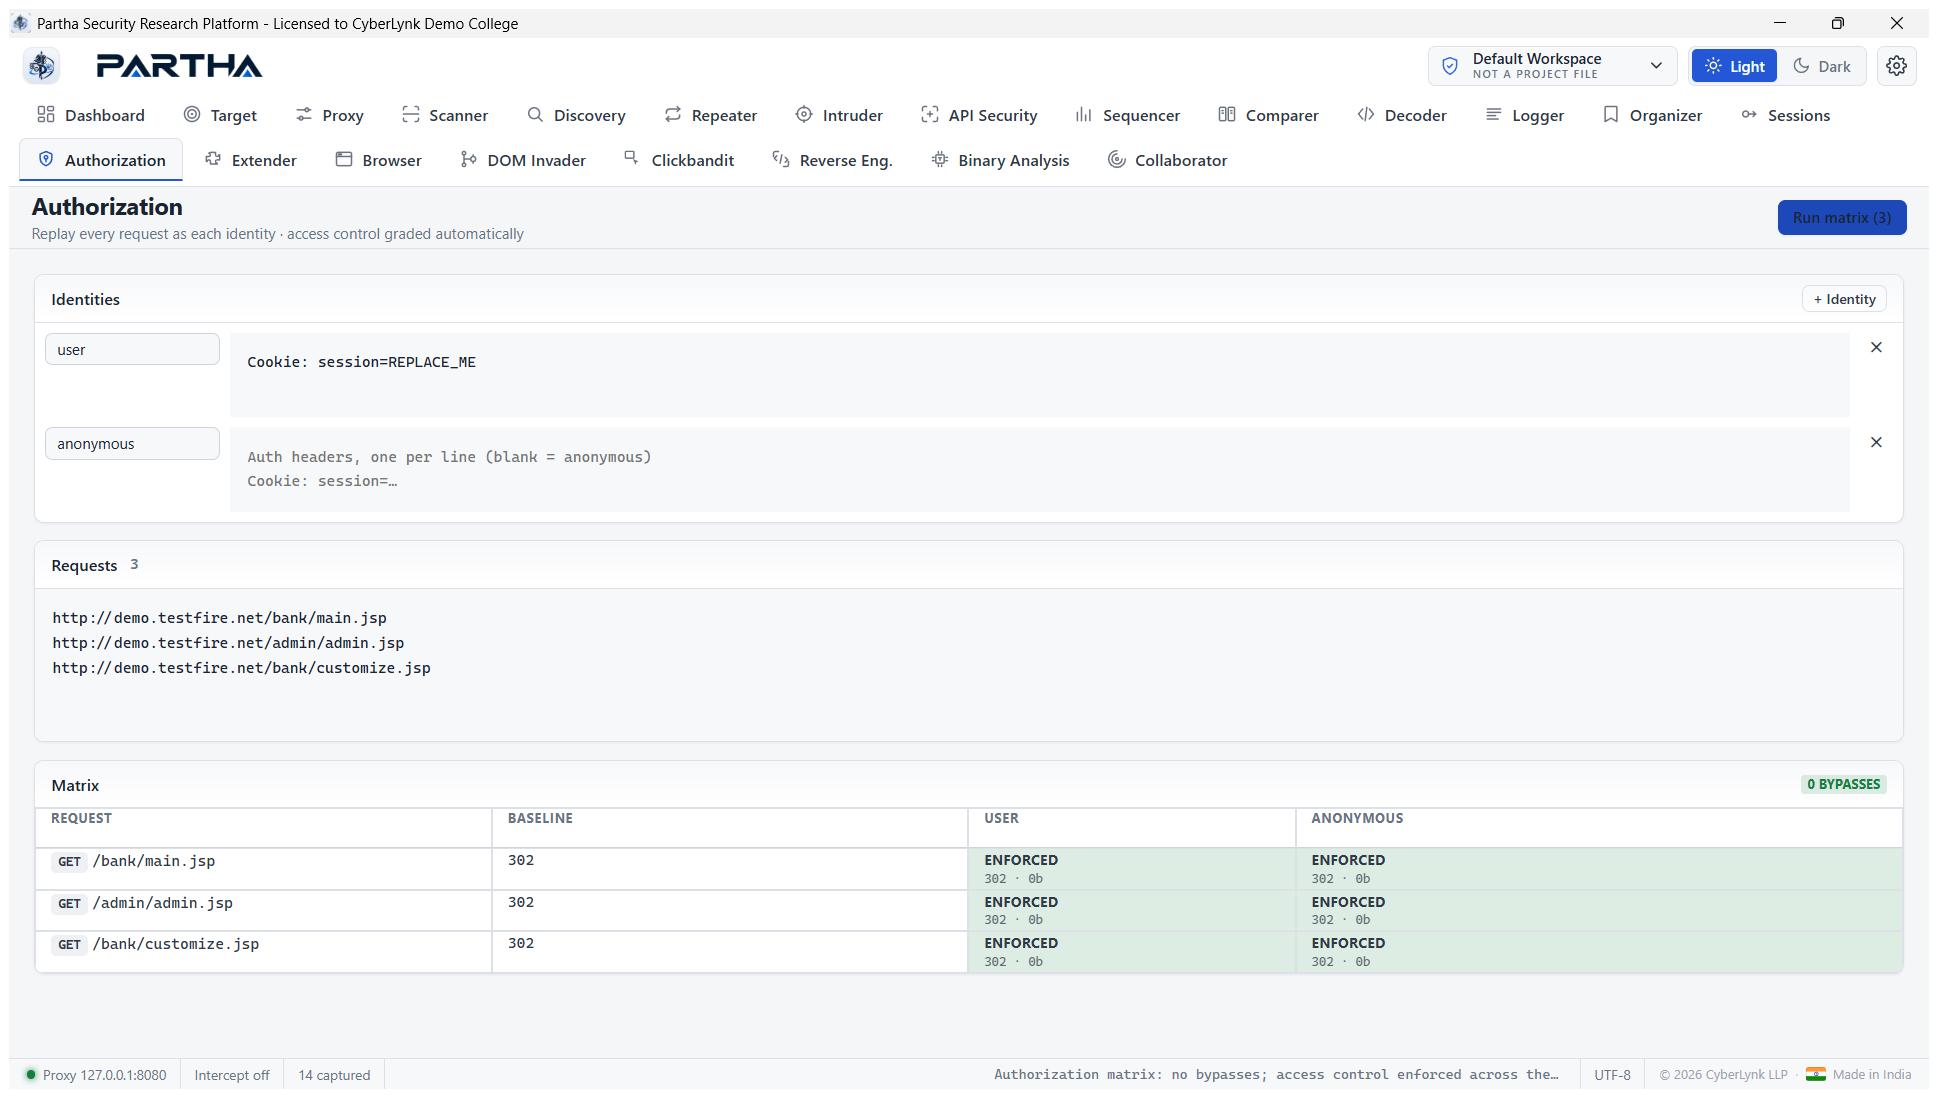
Steps: define Identities (each with its auth headers/cookies), add the Requests to test (paste URLs, or send from elsewhere), then Run matrix. Cells where a low-privilege identity succeeds are flagged as broken access control (CWE-284/639).
6.16 Extender — add-on module#
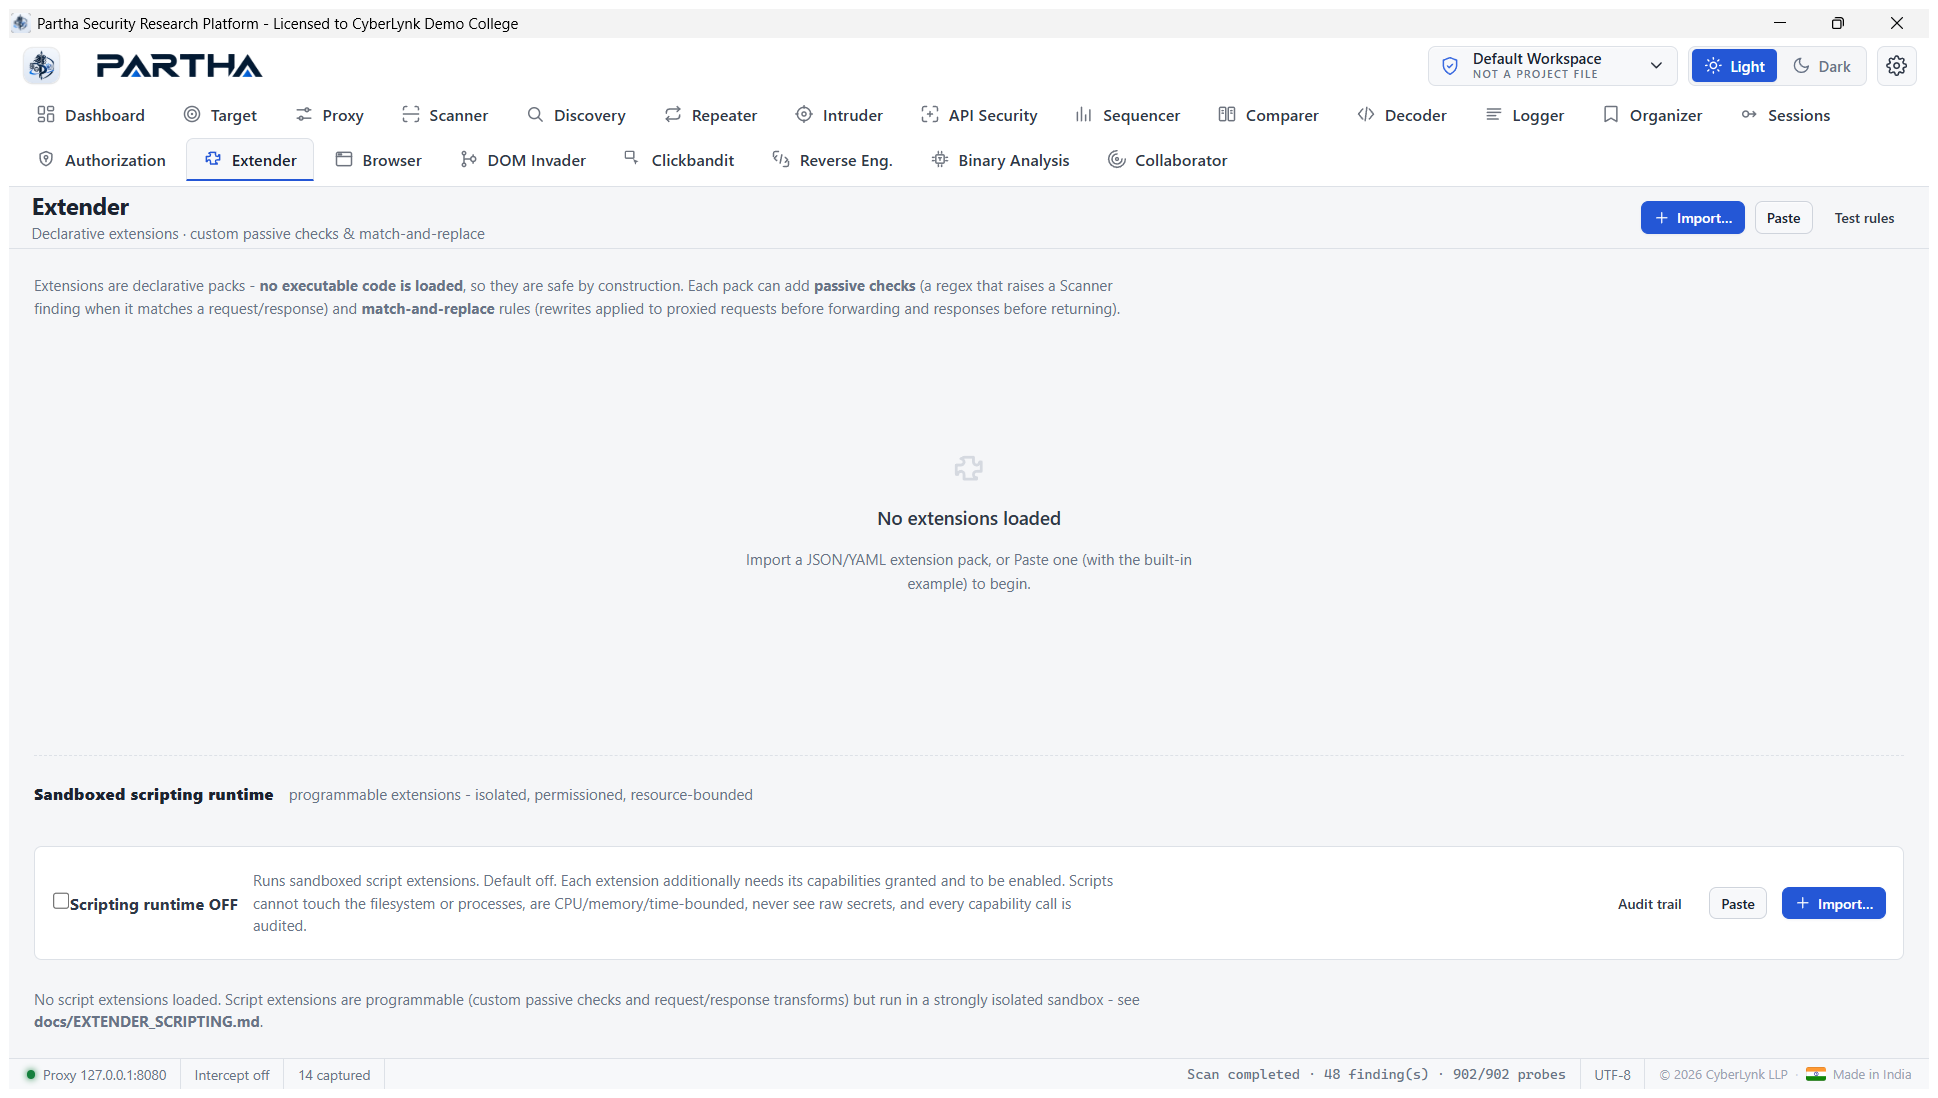
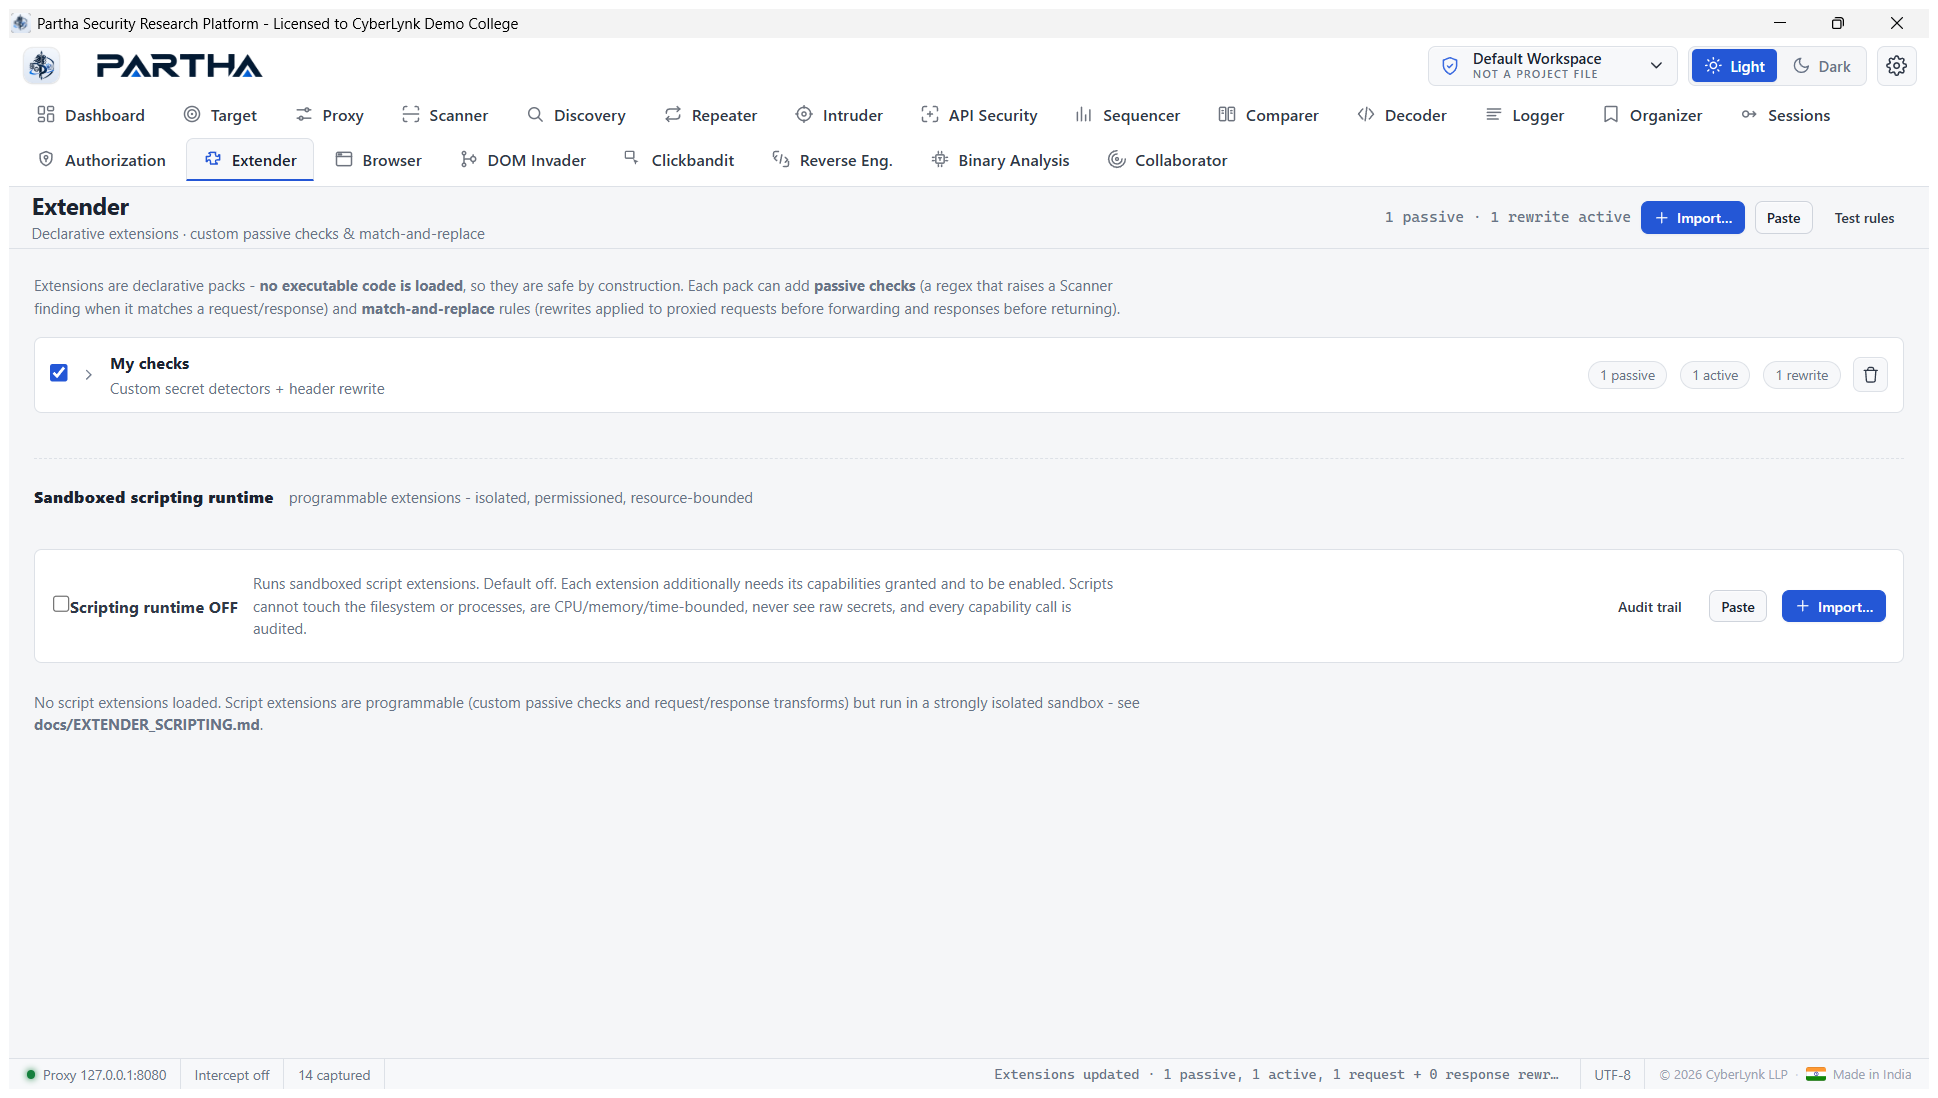
The extensibility / add-on module — extend Partha with declarative packs and a sandboxed scripting runtime, safe by construction.
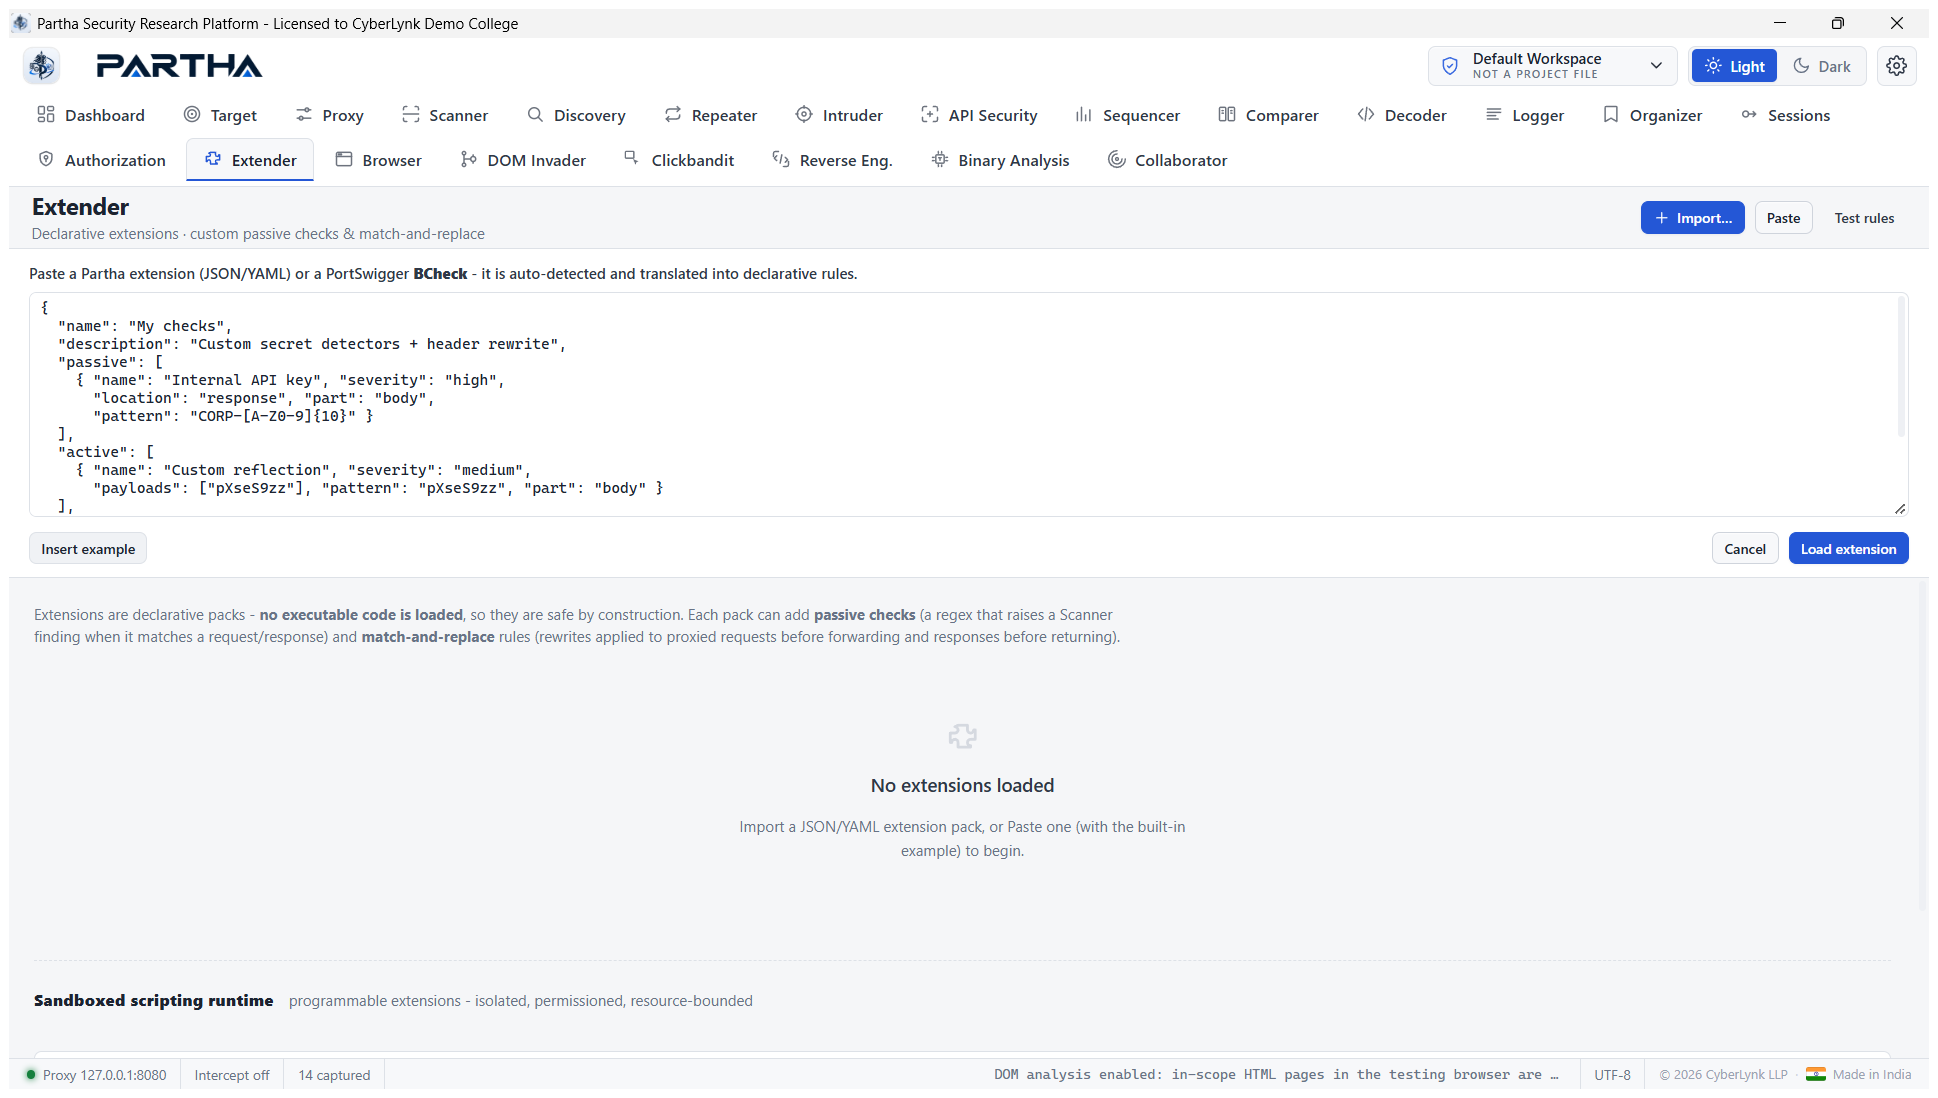
Composing a pack — Paste (or Import) a Partha extension or a PortSwigger BCheck; it is auto-detected and translated into declarative rules. The example pack adds a passive secret detector, a custom active check, and a match-and-replace rule:
Loaded — after Load extension the pack "My checks" is enabled (1 passive · 1 active · 1 rewrite):
-
Custom passive checks (BChecks) — a regex that raises a Scanner finding (quick custom checks in a simple, purpose-built language).
-
Custom active checks — payloads + a response-match pattern.
-
Match-and-replace rules — rewrite request URL/header/body and response header/body, applied automatically in the Proxy.
-
Sandboxed scripting runtime — programmable extensions in a strongly isolated sandbox (no filesystem/process access, resource-bounded, never see raw secrets, every capability call audited). This is the "add-on module" and also fuels vulnerability coverage with custom logic. Test rules dry-runs a pack against a sample response to show exactly which rules fire before you enable it:
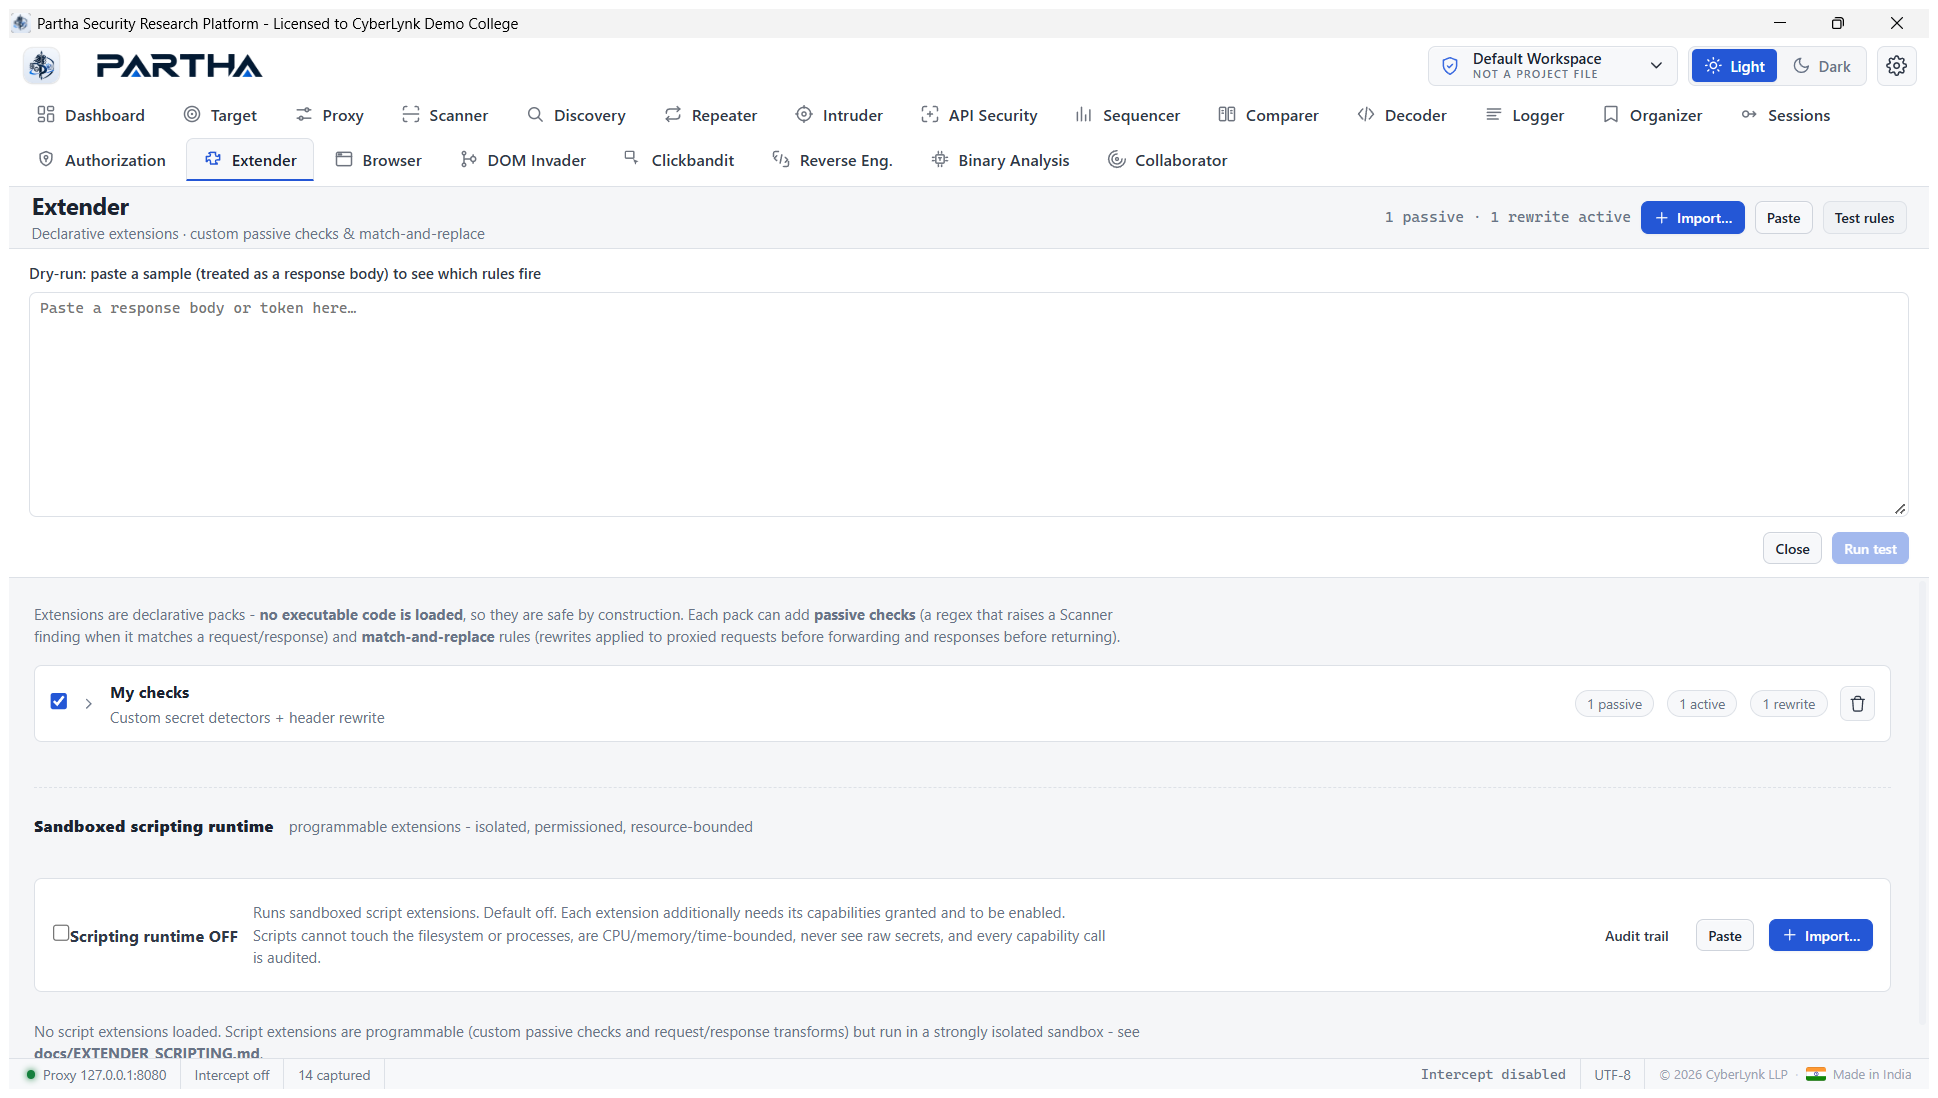
Steps: Paste the example (or your pack) → Insert example → Load extension; its passive checks + match/replace rules take effect immediately. Use Test rules to dry-run first.
6.17 Browser — built-in browser#
Scan using a built-in browser that navigates JavaScript-heavy apps and SPAs just like a user, routed through the proxy.
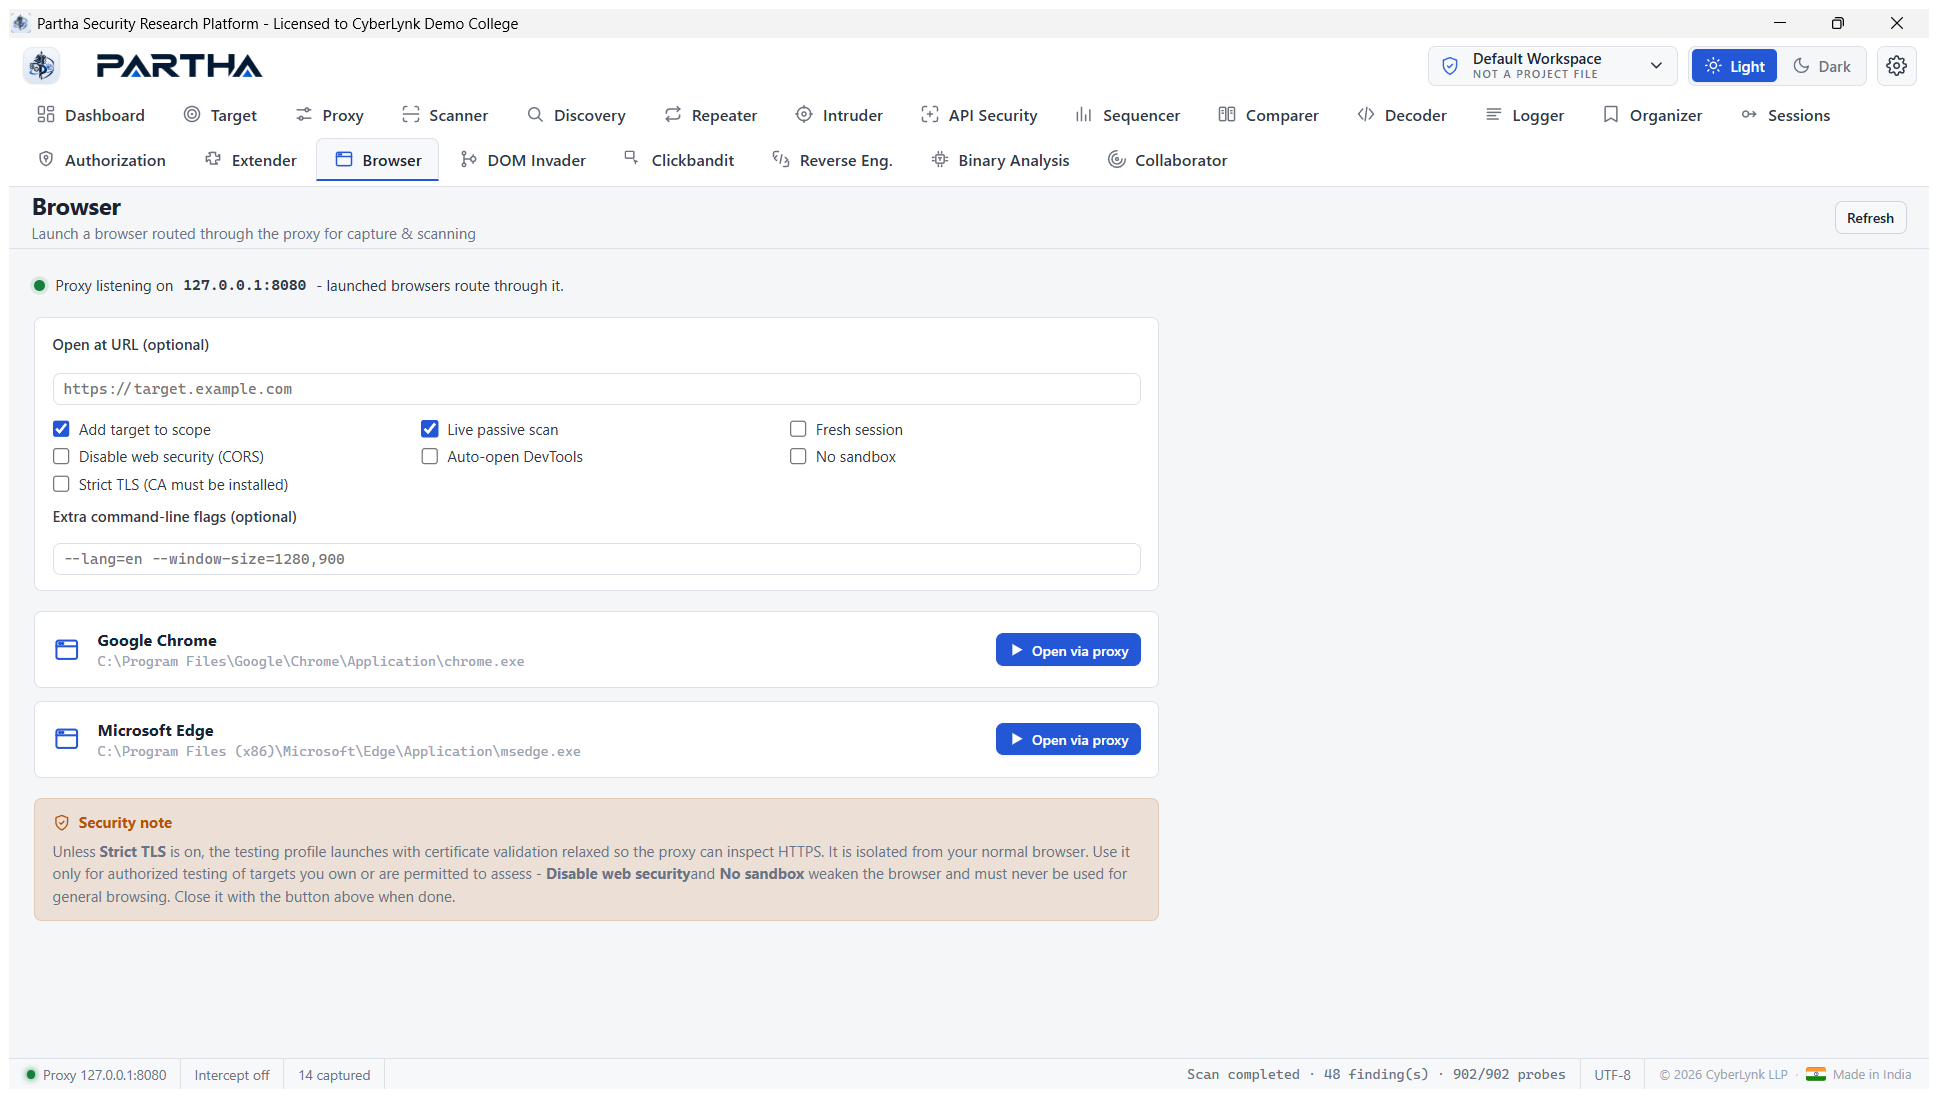
Partha detects installed Chromium-family browsers and launches one with an isolated testing profile wired to the proxy, so all its traffic is captured and can be scanned. Options: open at a URL, Add target to scope, Live passive scan, Fresh session, Disable web security (CORS), Auto-open DevTools, No sandbox, Strict TLS, plus extra flags.
Steps: set options → Open via proxy on Chrome/Edge → browse; everything is captured and (optionally) scanned live. Close when done.
6.18 DOM Invader#
Test for DOM-based vulnerabilities — DOM-XSS, prototype pollution and unsafe
postMessage, automatically, as you browse.
The three-step wizard, shown Active (green) after turning it on — in-scope HTML pages opened in the testing browser are now instrumented:
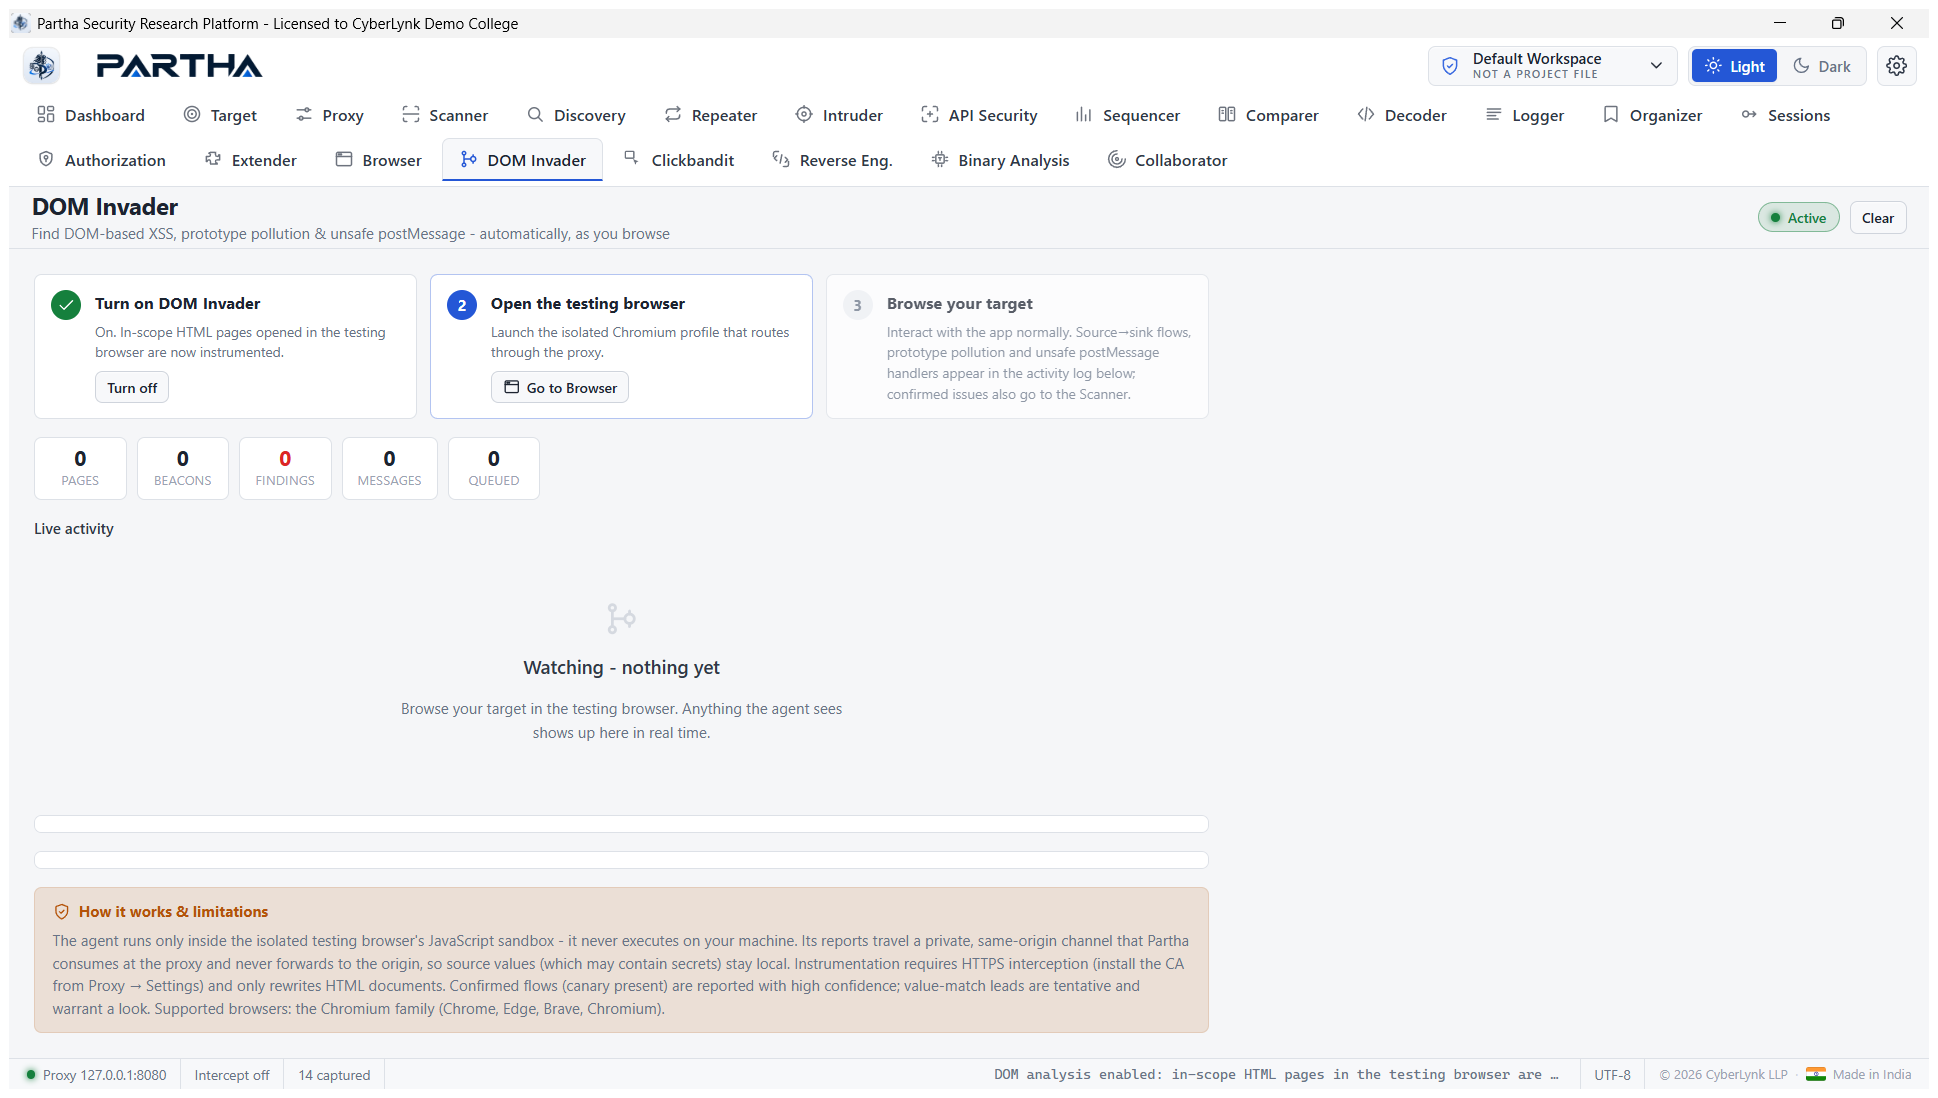
Steps: (1) Turn on DOM Invader → (2) Open the testing browser →
(3) Browse your target. Source→sink flows, prototype pollution and unsafe
postMessage handlers appear in the live activity log; confirmed issues also go
to the Scanner. The agent runs only inside the isolated testing browser's
sandbox — it never executes on your machine, and its reports never reach the
origin, so source values (which may contain secrets) stay local.
Real result — browsing a page whose location.hash (a source) flows into
innerHTML and document.write (sinks), through the testing browser, produced
3 findings live. The agent injected its canary into the source and traced it
to each sink — a DOM-based cross-site scripting (HTML sink) [high], an unsafe
postMessage listener with no origin validation, and untrusted data written to
client storage:
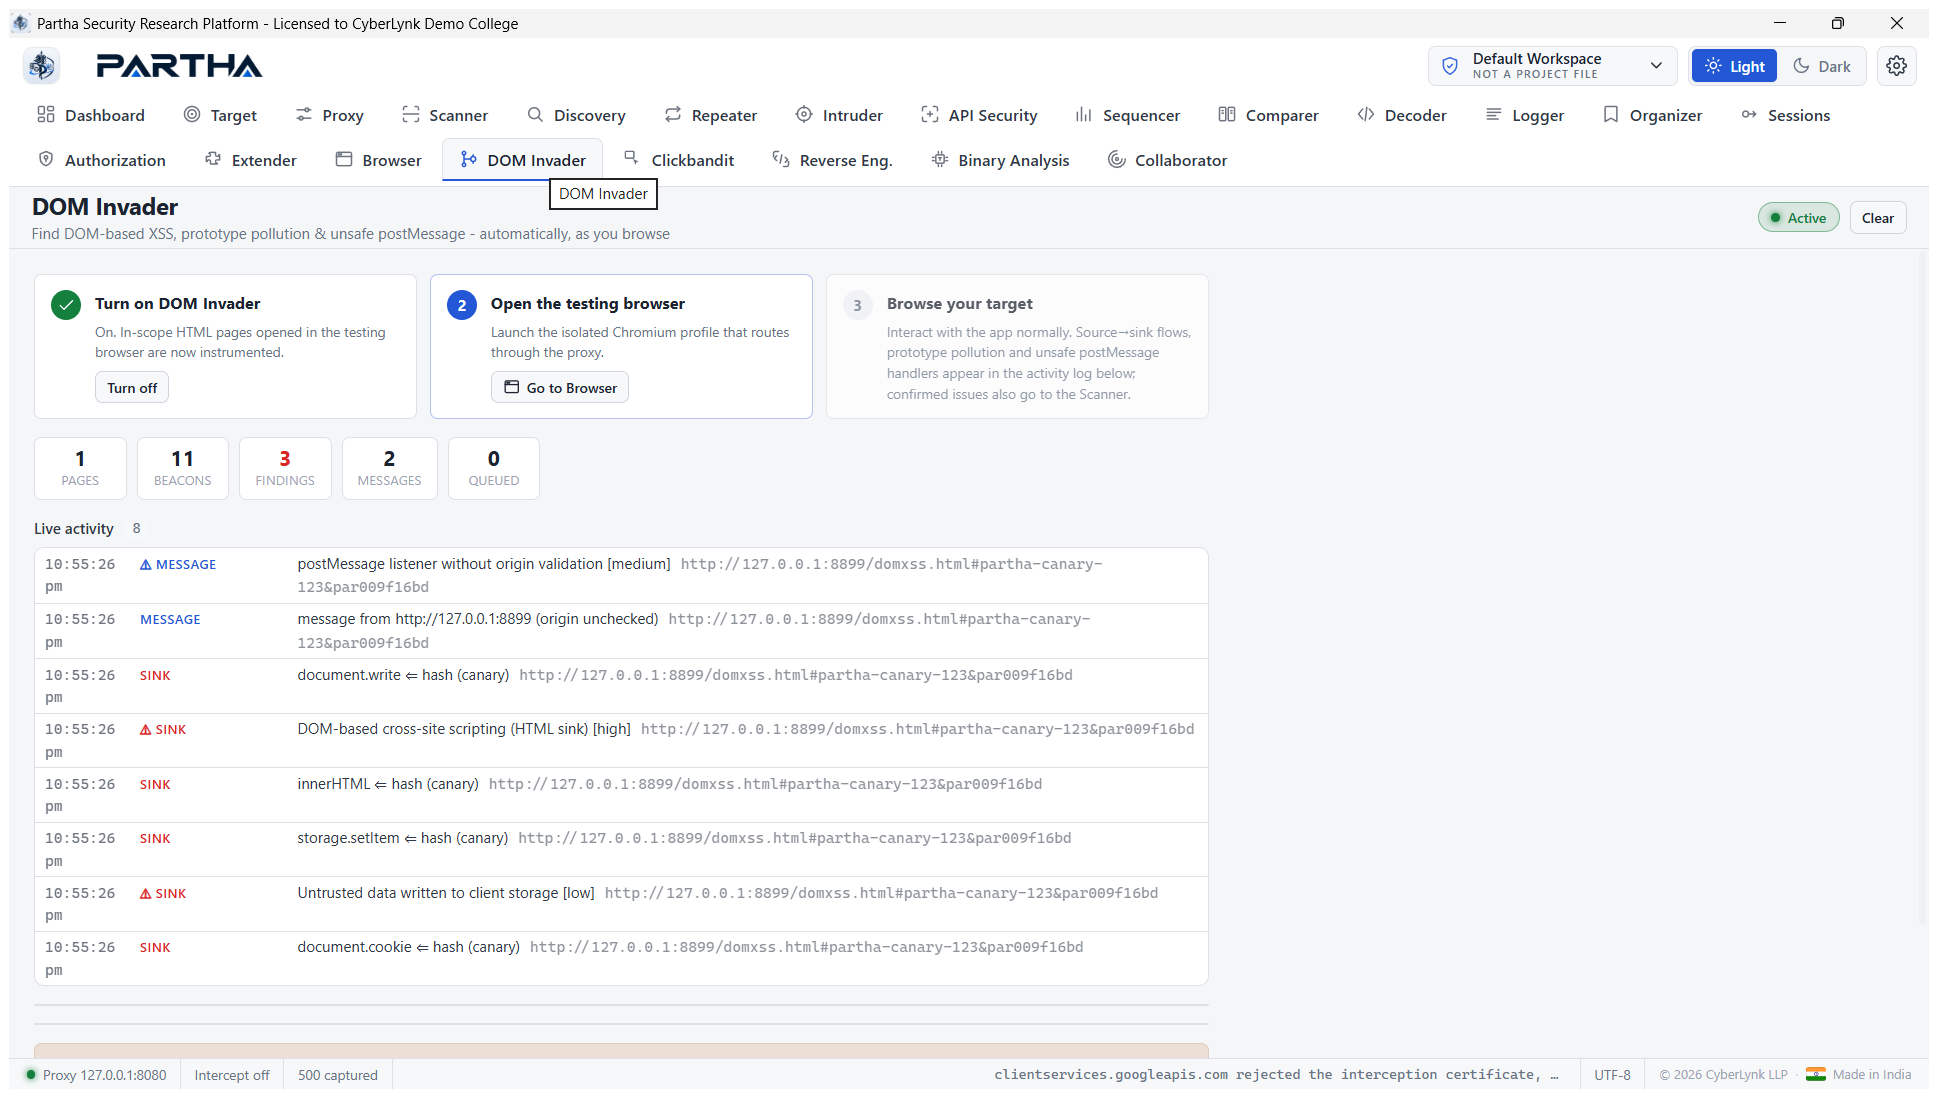
(demo.testfire.net has no DOM sink to trip, so this finding was produced
against a page with a real location.hash → innerHTML sink — exactly the class
DOM Invader is built to catch.)
6.19 Clickbandit — clickjacking & CSRF PoC#
Easily generate proof-of-concept attacks.
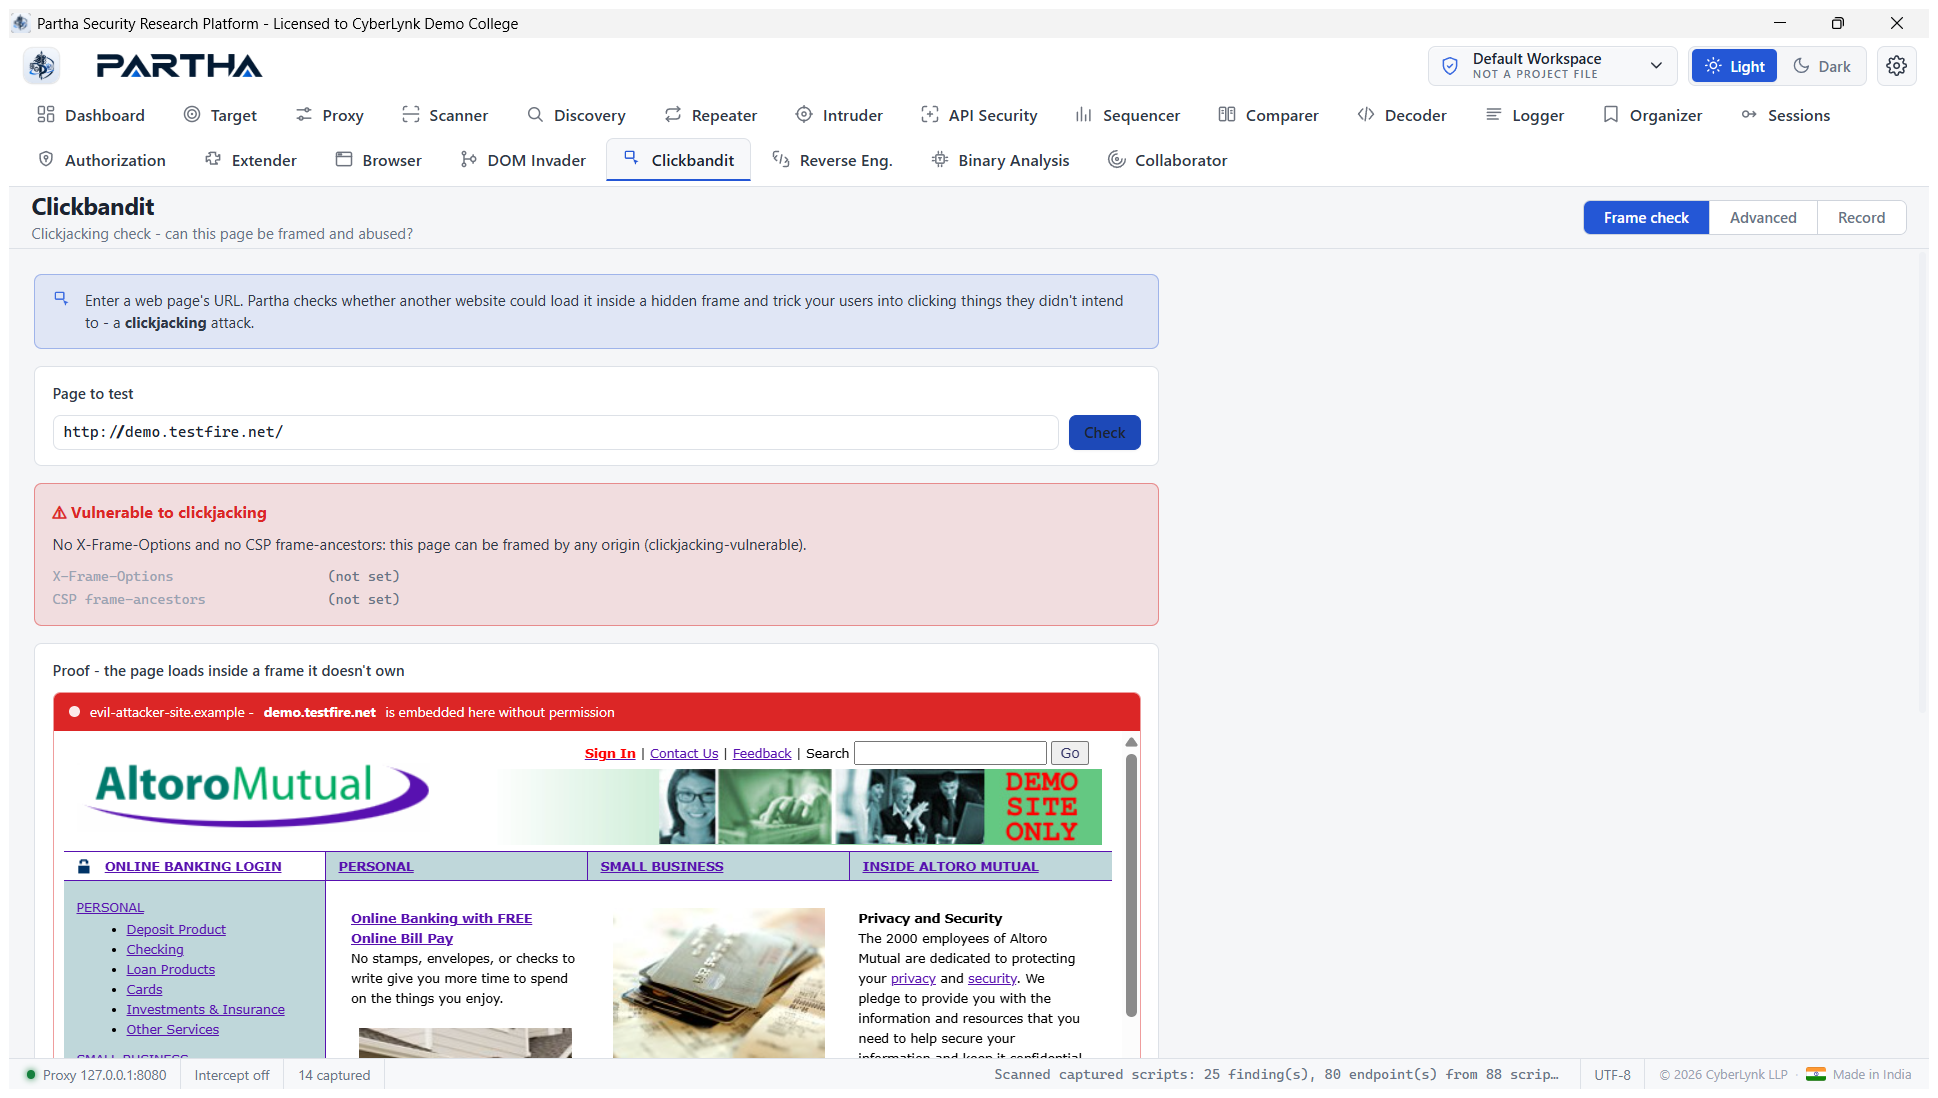
Frame check — enter a URL and Check. For http://demo.testfire.net/ the
real verdict is ⚠ Vulnerable to clickjacking (no X-Frame-Options, no CSP
frame-ancestors), with a live proof frame that actually embeds the real Altoro
Mutual site inside a fake attacker page:
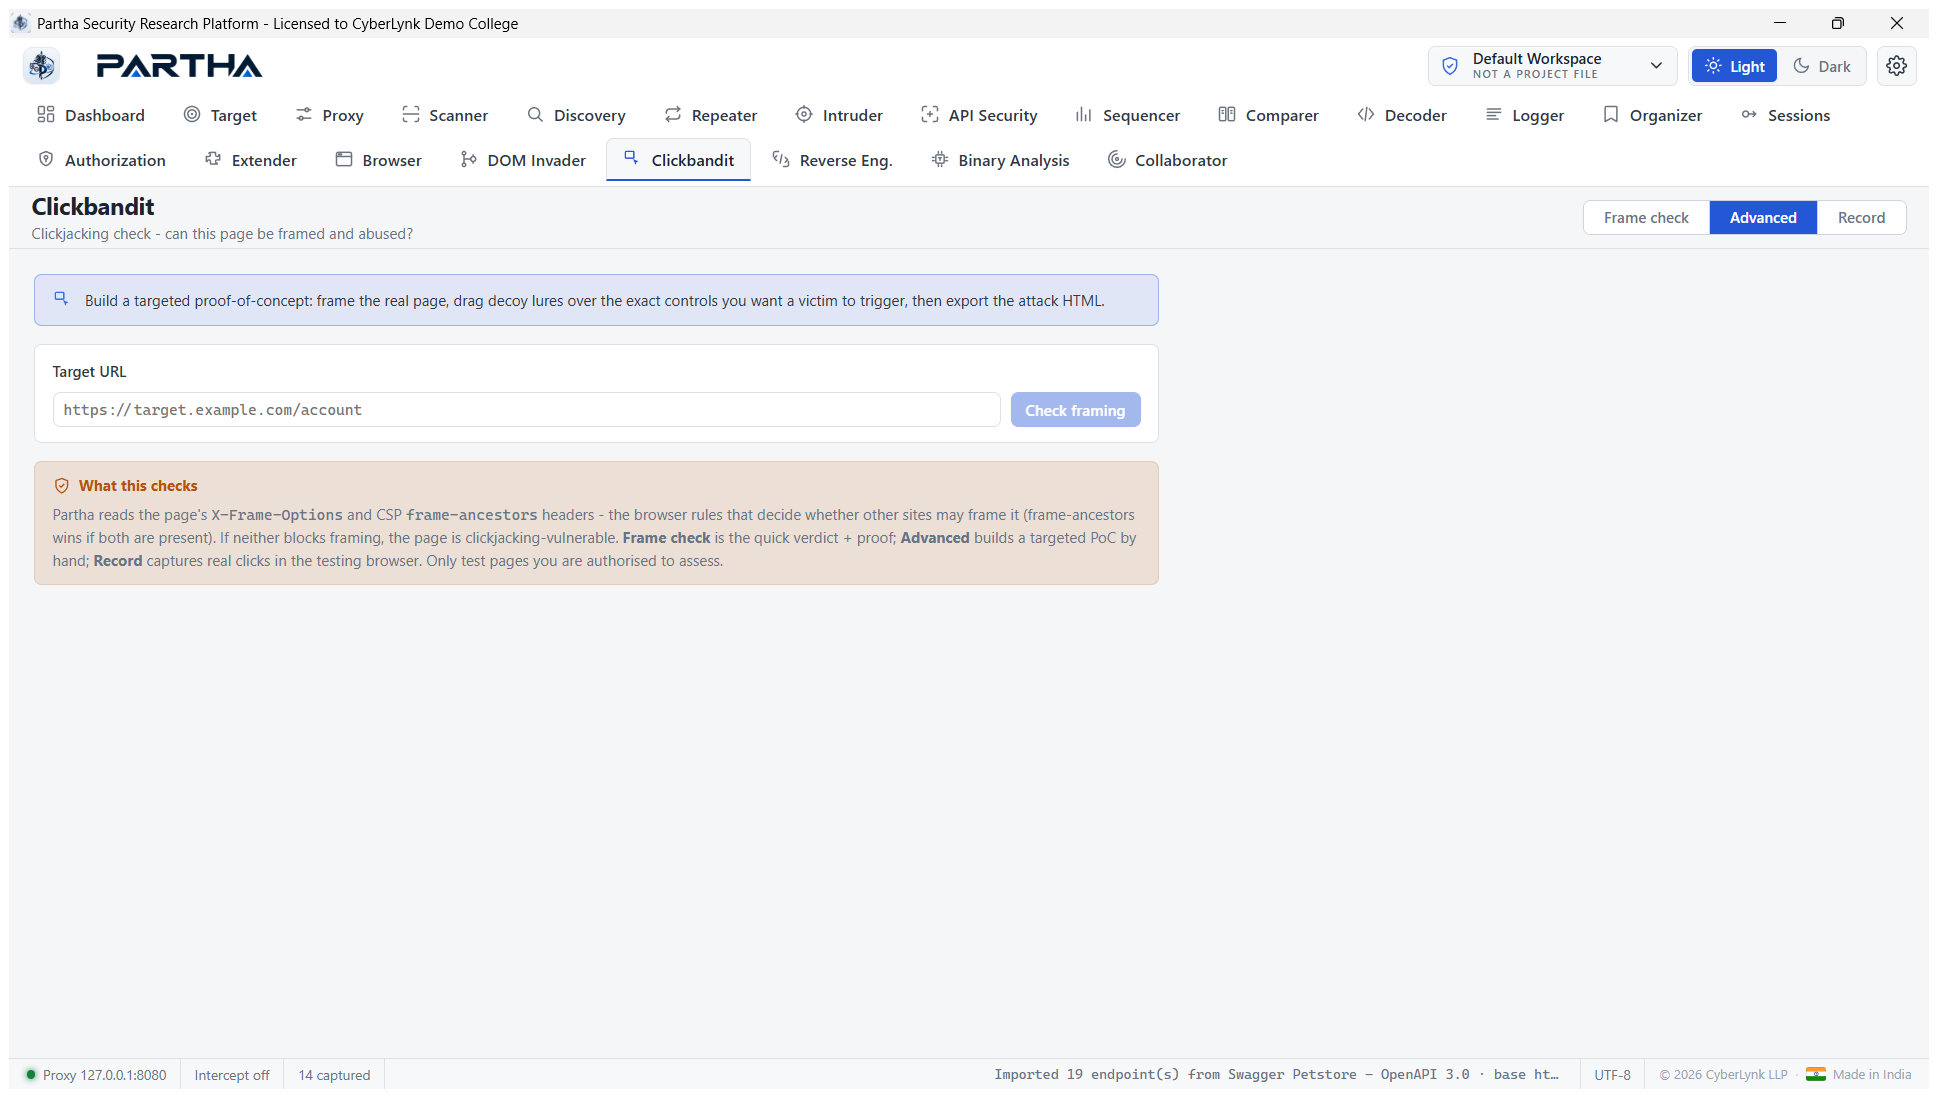
Advanced — build a targeted PoC by hand: frame the real page, drag decoy lures over the exact controls, then export standalone attack HTML:
-
Frame check — quick verdict + visual proof.
-
Advanced — targeted PoC authoring + export.
-
Record — open the target in the isolated testing browser and record each real click as a decoy, then raise a finding + PoC:
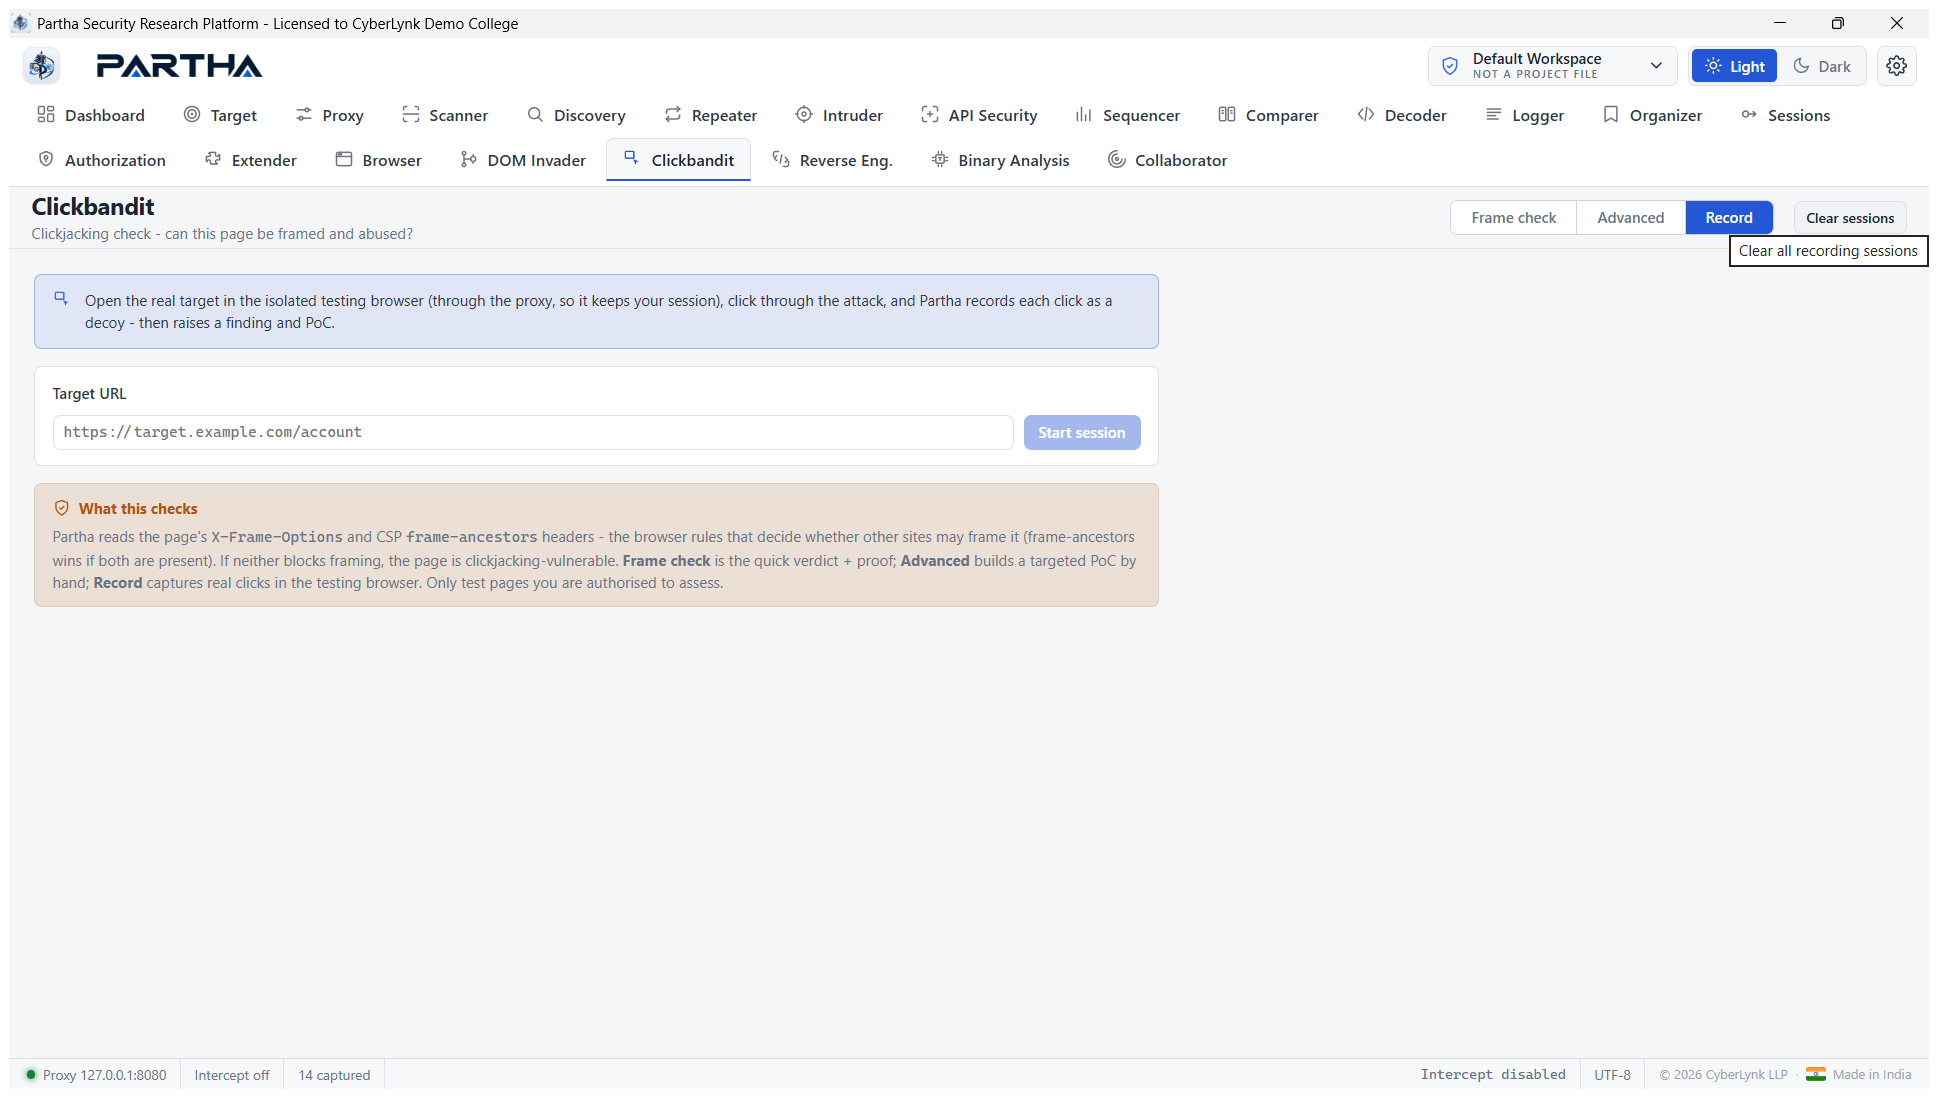
CSRF PoC proper is generated from any Scanner finding via the CSRF PoC button on its advisory (§6.4).
6.20 Reverse Engineering — JavaScript analysis engine#
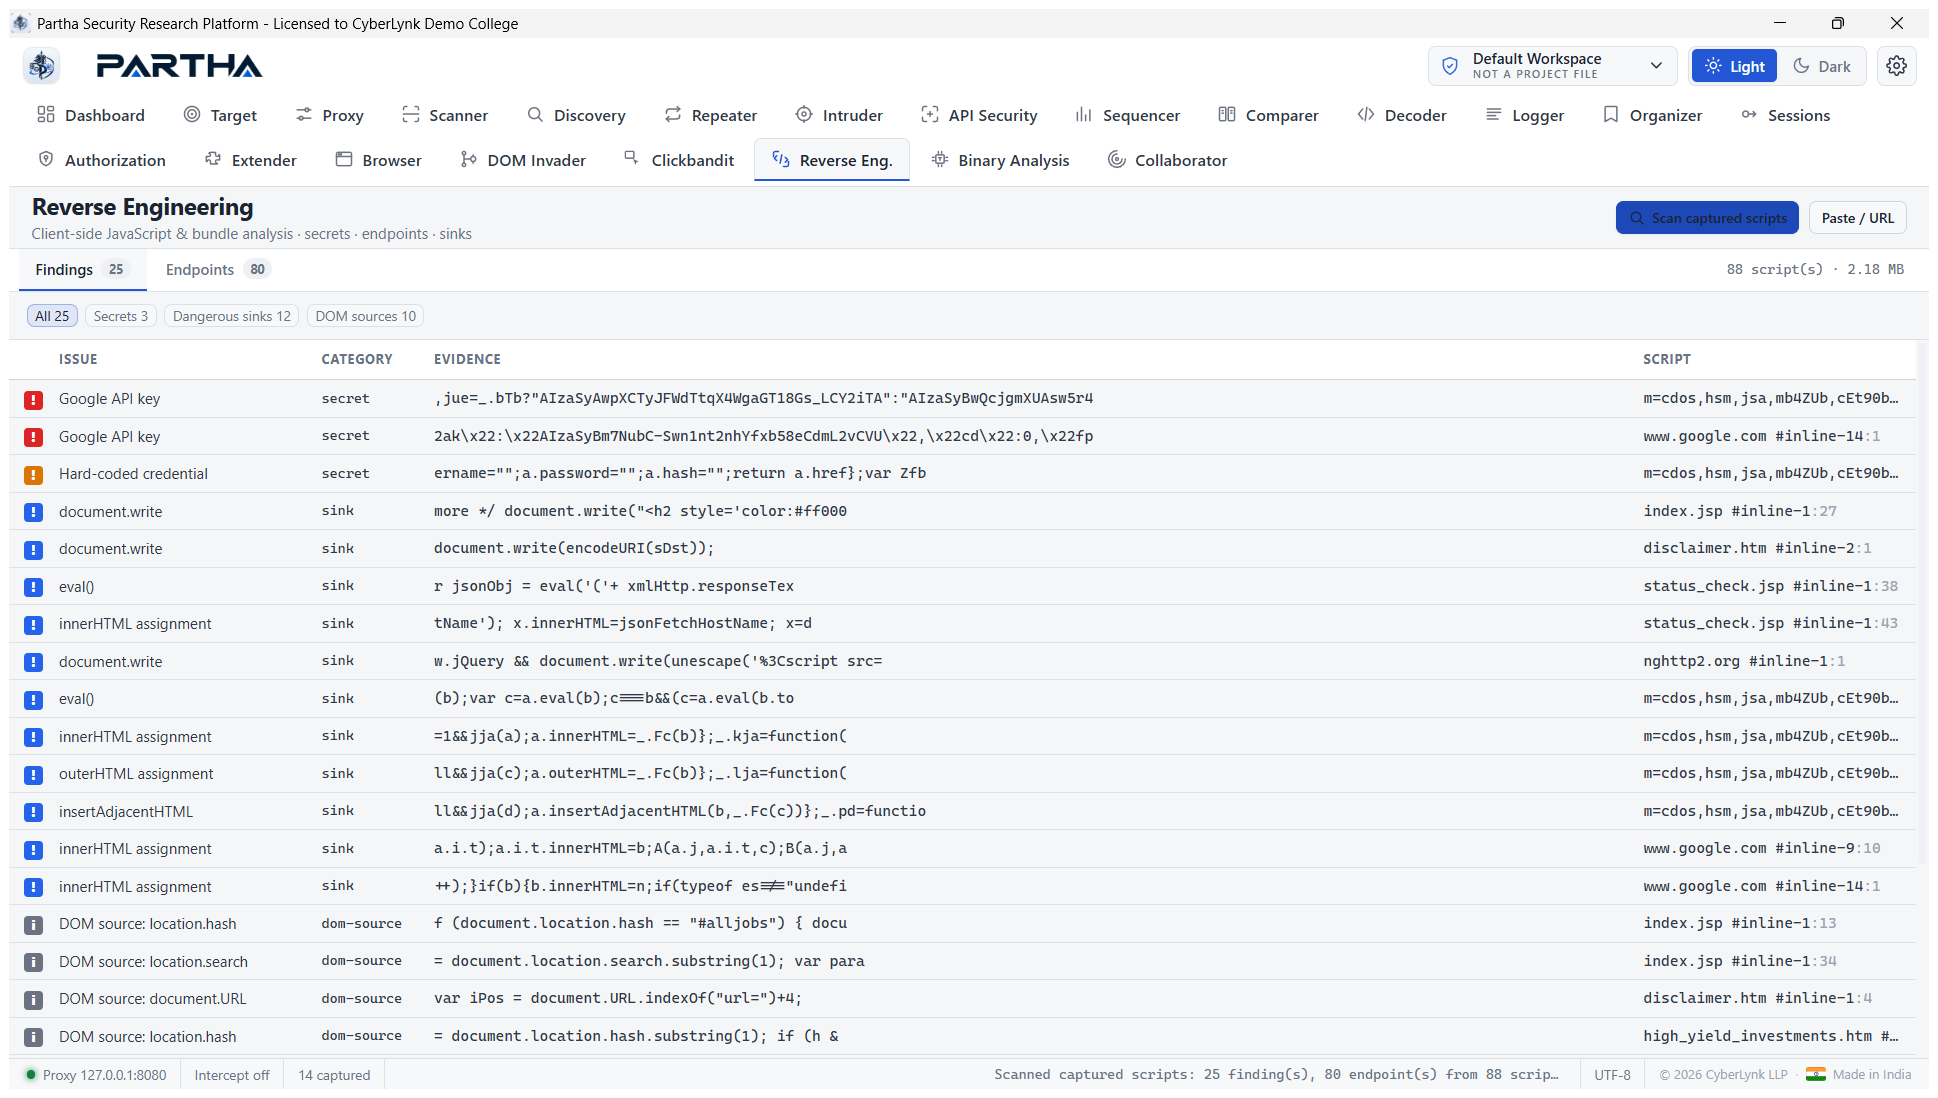
Conquer client-side attack surface with the built-in JavaScript analysis
engine — statically analyse captured scripts (external .js and inline
<script>) for secrets, endpoints and dangerous DOM sinks.
Real result — Scan captured scripts analysed 88 scripts (2.18 MB) →
25 findings (3 secrets incl. a hard-coded Google API key, 12 dangerous sinks
like eval() / document.write / innerHTML, 10 DOM sources) and 80
endpoints:
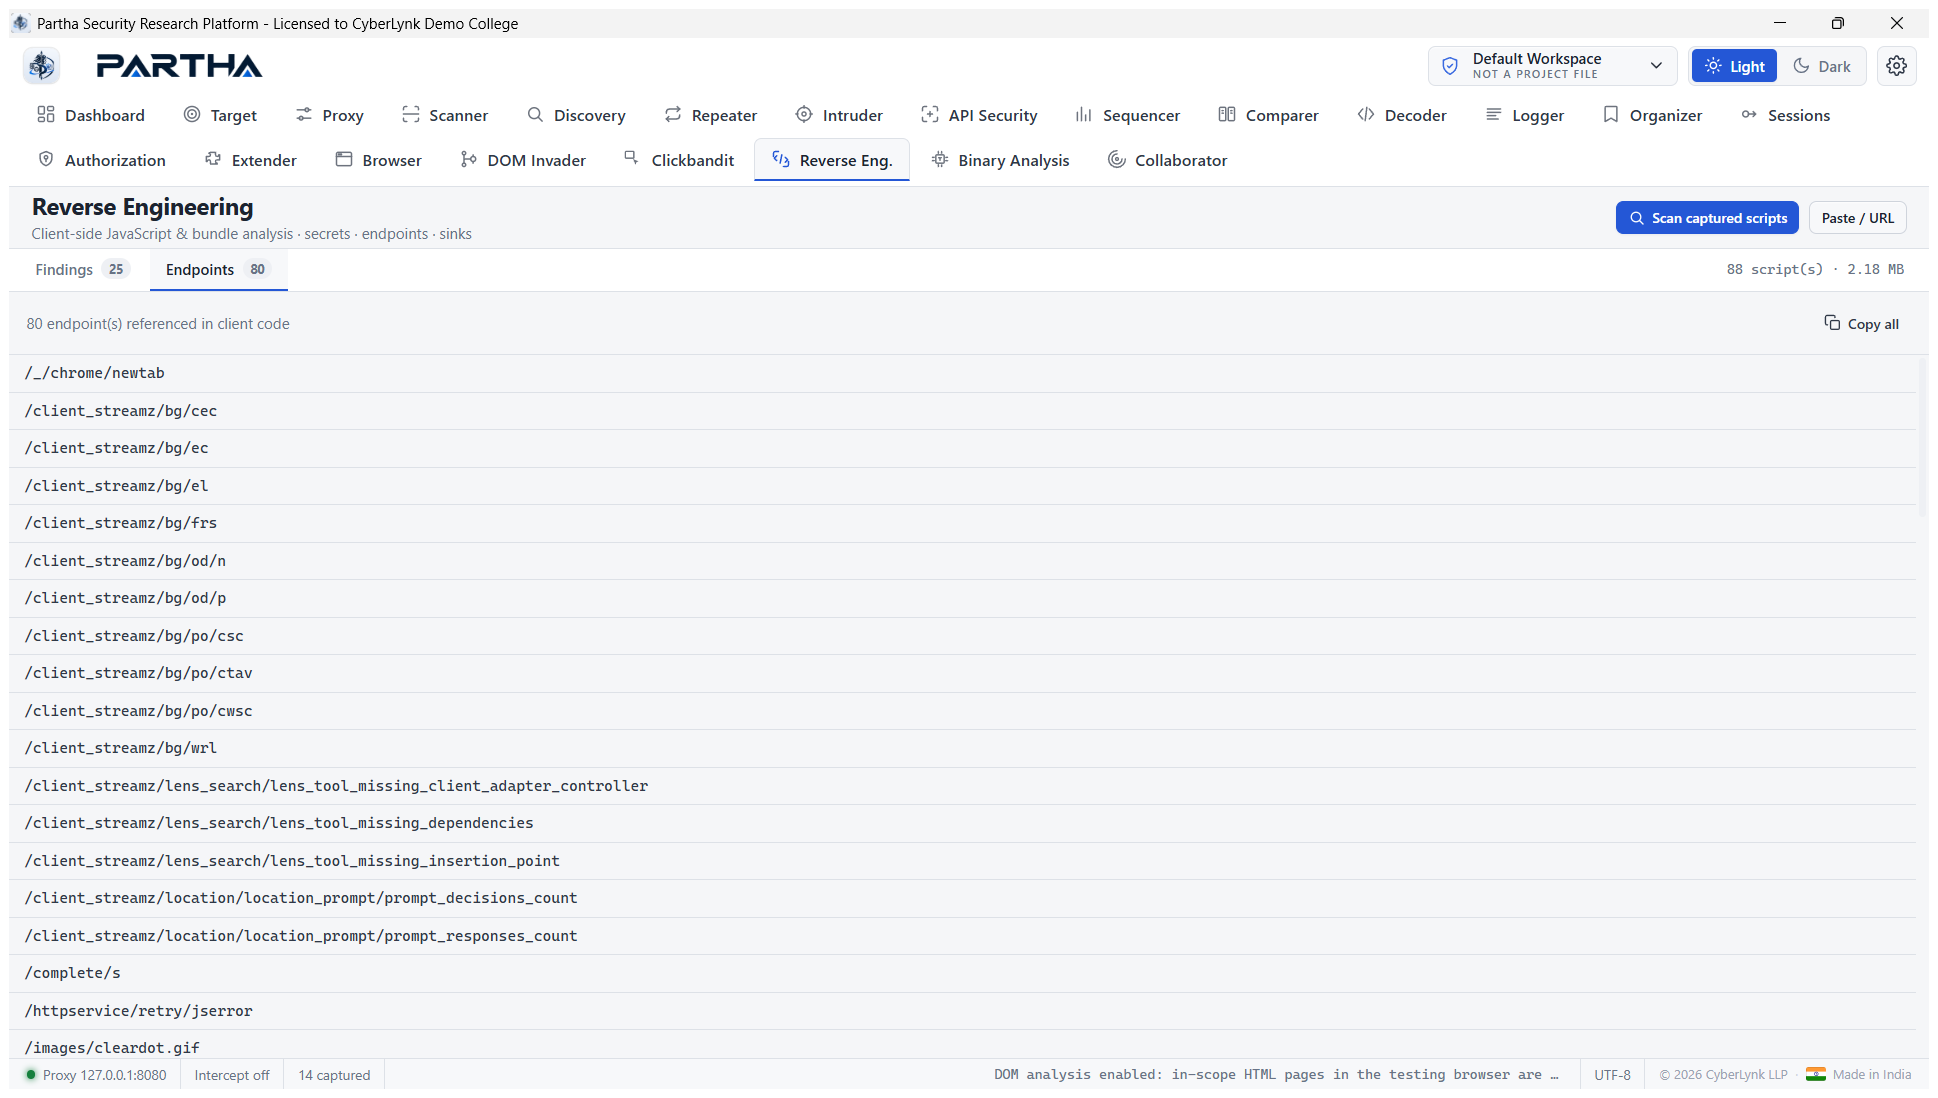
The Endpoints tab lists all 80 endpoints referenced in client code, ready to Copy all or send to Repeater:
Steps: capture traffic (Proxy/Browser), open Reverse Eng., and click Scan captured scripts — or Paste / URL to analyse a specific bundle. This is the static counterpart to the runtime DOM Invader (§6.18).
6.21 Binary Analysis — disassembler & cloud decompiler#
A first-class binary reverse-engineering module with two independent surfaces:
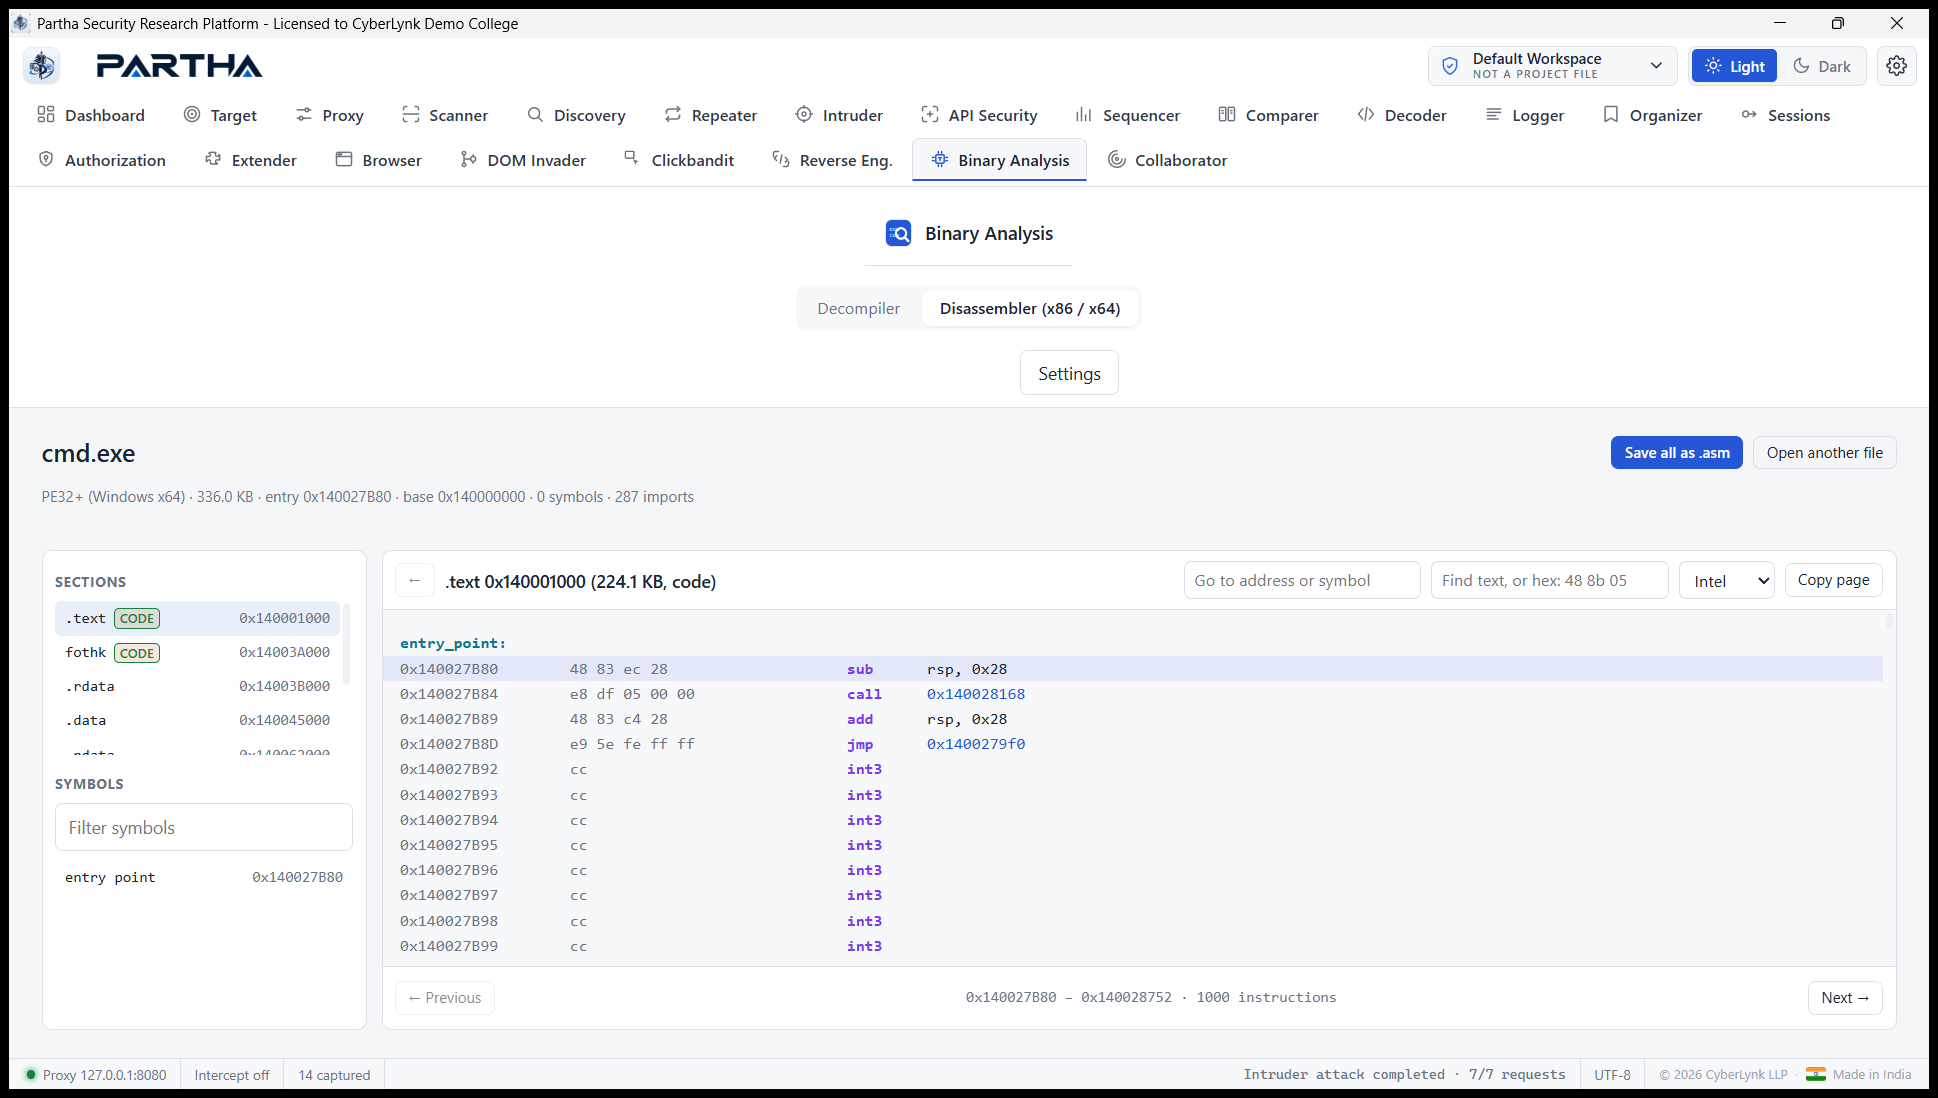
Disassembler (x86 32/64) — entirely on this PC. Real
result — disassembling a real Windows PE (cmd.exe, PE32+ x64, entry
0x140027B80, 287 imports) shows the annotated x64 listing with sections,
symbols, Intel syntax, clickable branch targets, go-to/search, and Save all as
.asm. The file never leaves the PC and is never executed:
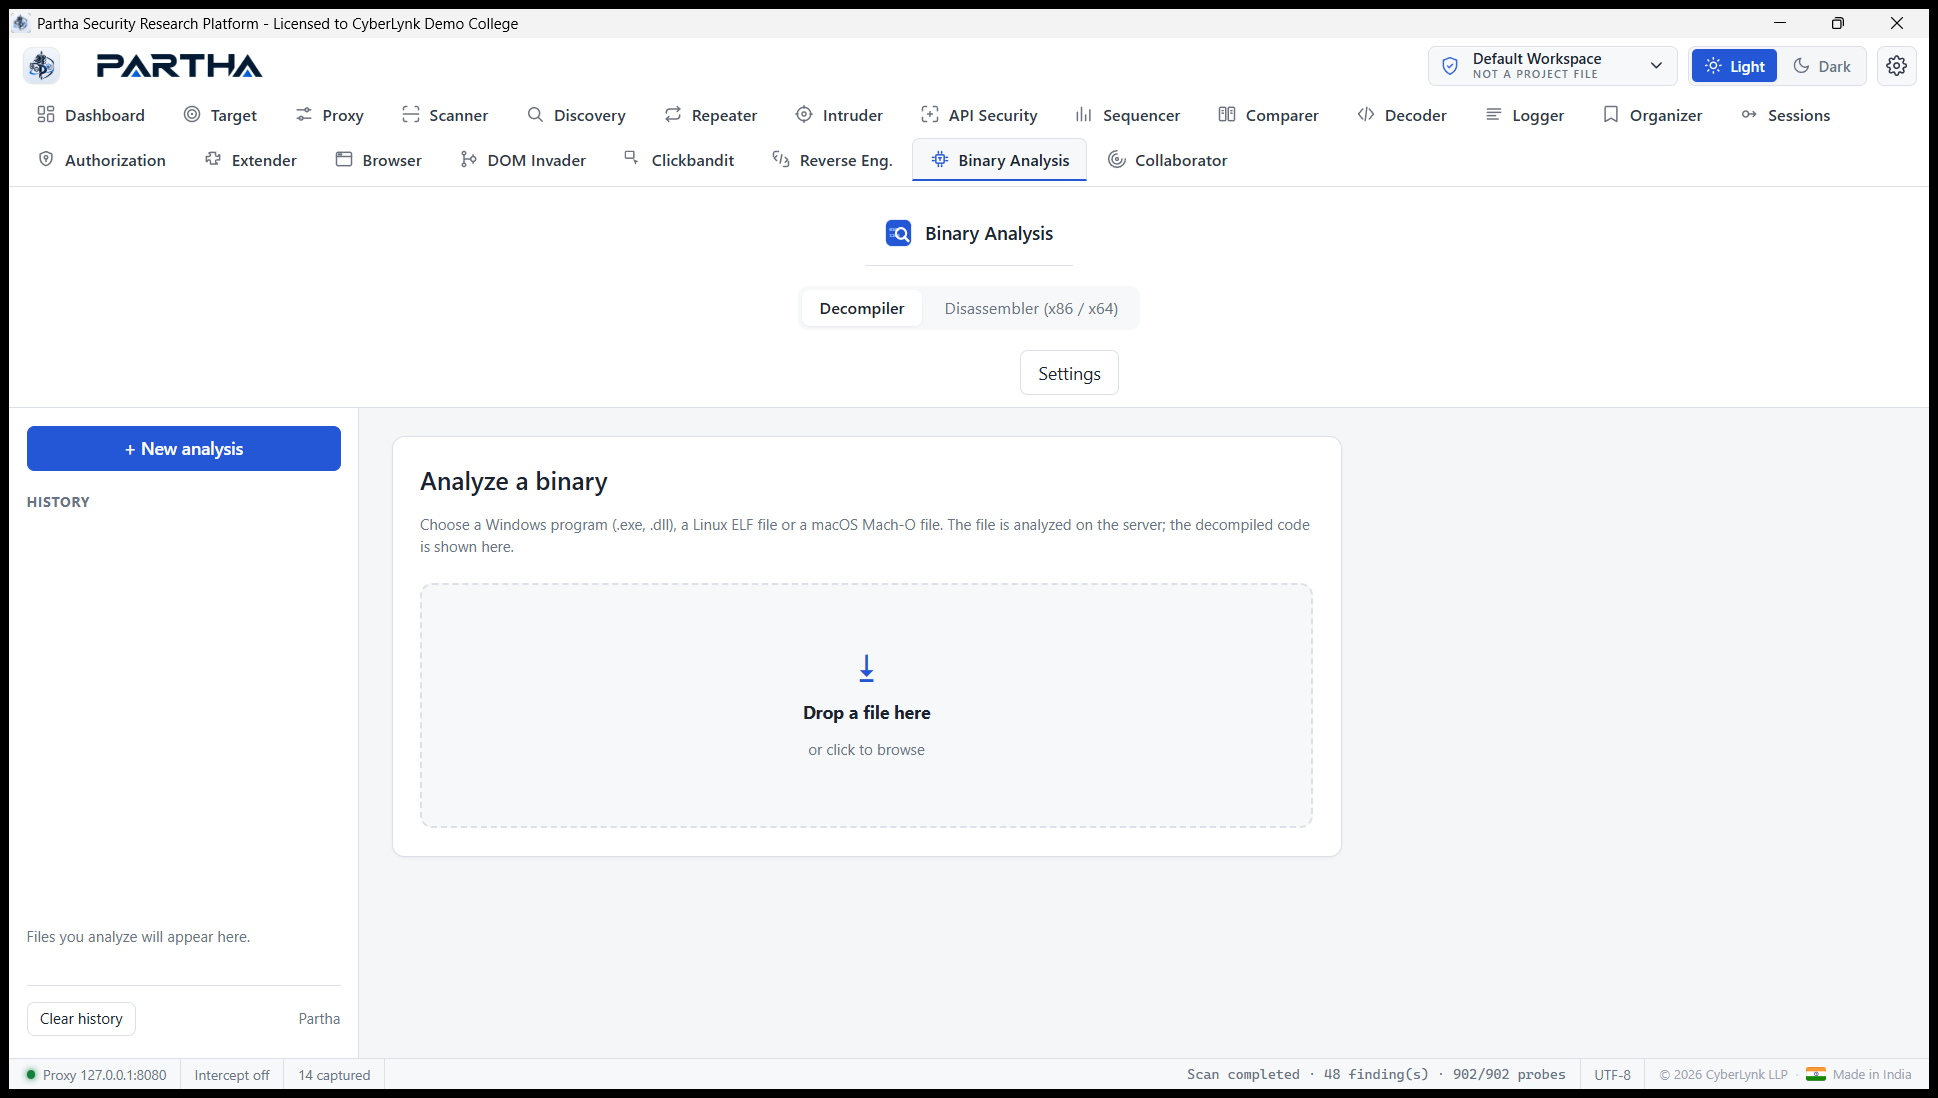
Decompiler — cloud-based. Upload one binary to the analysis
server (the address you configure in the Decompiler settings), where it is decompiled
in a network-isolated sandbox. Real result — uploading hostname.exe
completed on the server with 38 of 38 functions decompiled (48 imports, 17
libraries, 9 sections, 154 strings); the decompiled C is shown with a filterable
function list, syntax highlighting, and Copy / Save as .c. Only the uploaded
file leaves the PC; the server never executes it:
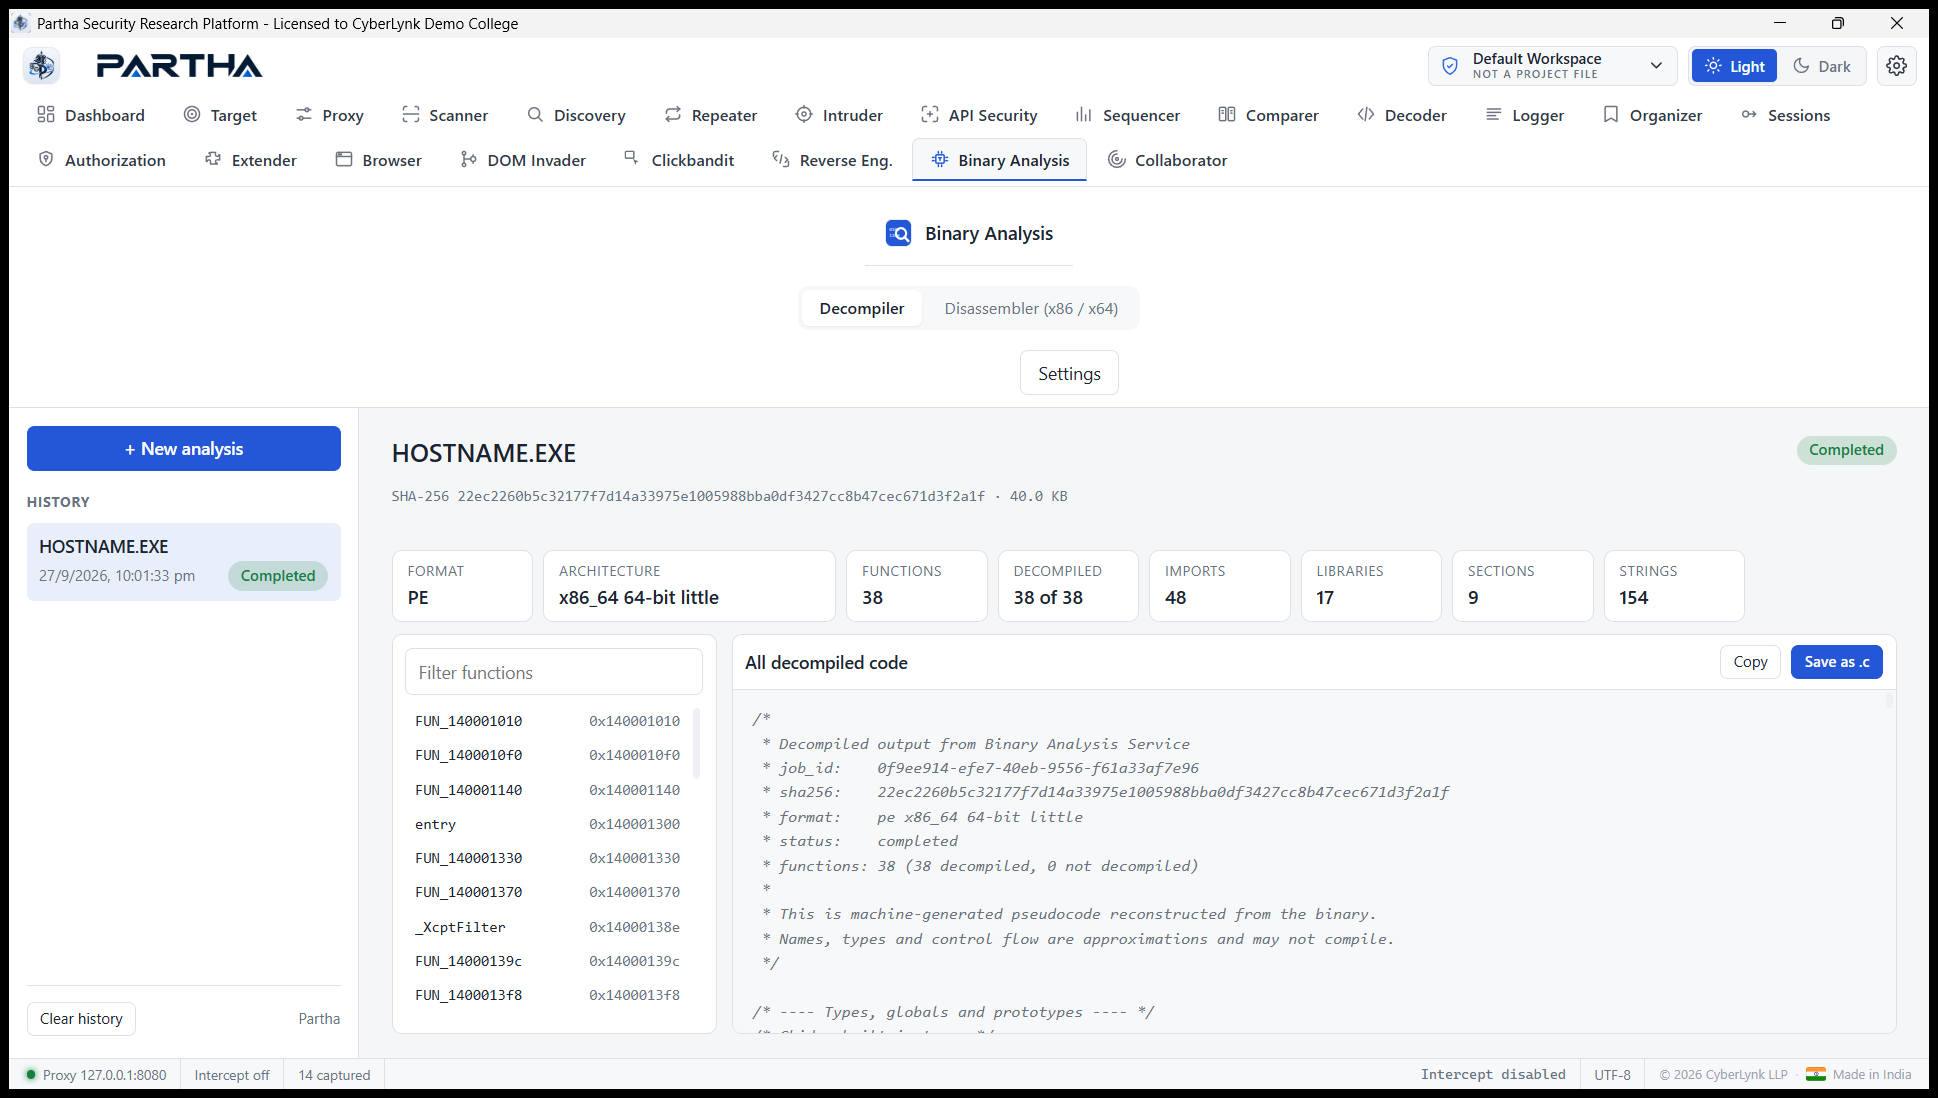
Steps: on Disassembler, drop a file (or click to browse), pick a section and syntax, read the listing, and Save all .asm. On Decompiler, drop a file to submit it, watch the job (queued → running → completed), and read/copy/ save the C. Analyzed files appear in the History sidebar.
6.22 Collaborator — OAST#
Detect otherwise-invisible vulnerabilities with out-of-band application security testing (OAST). Partha runs its own listener (HTTP + DNS + SMTP).
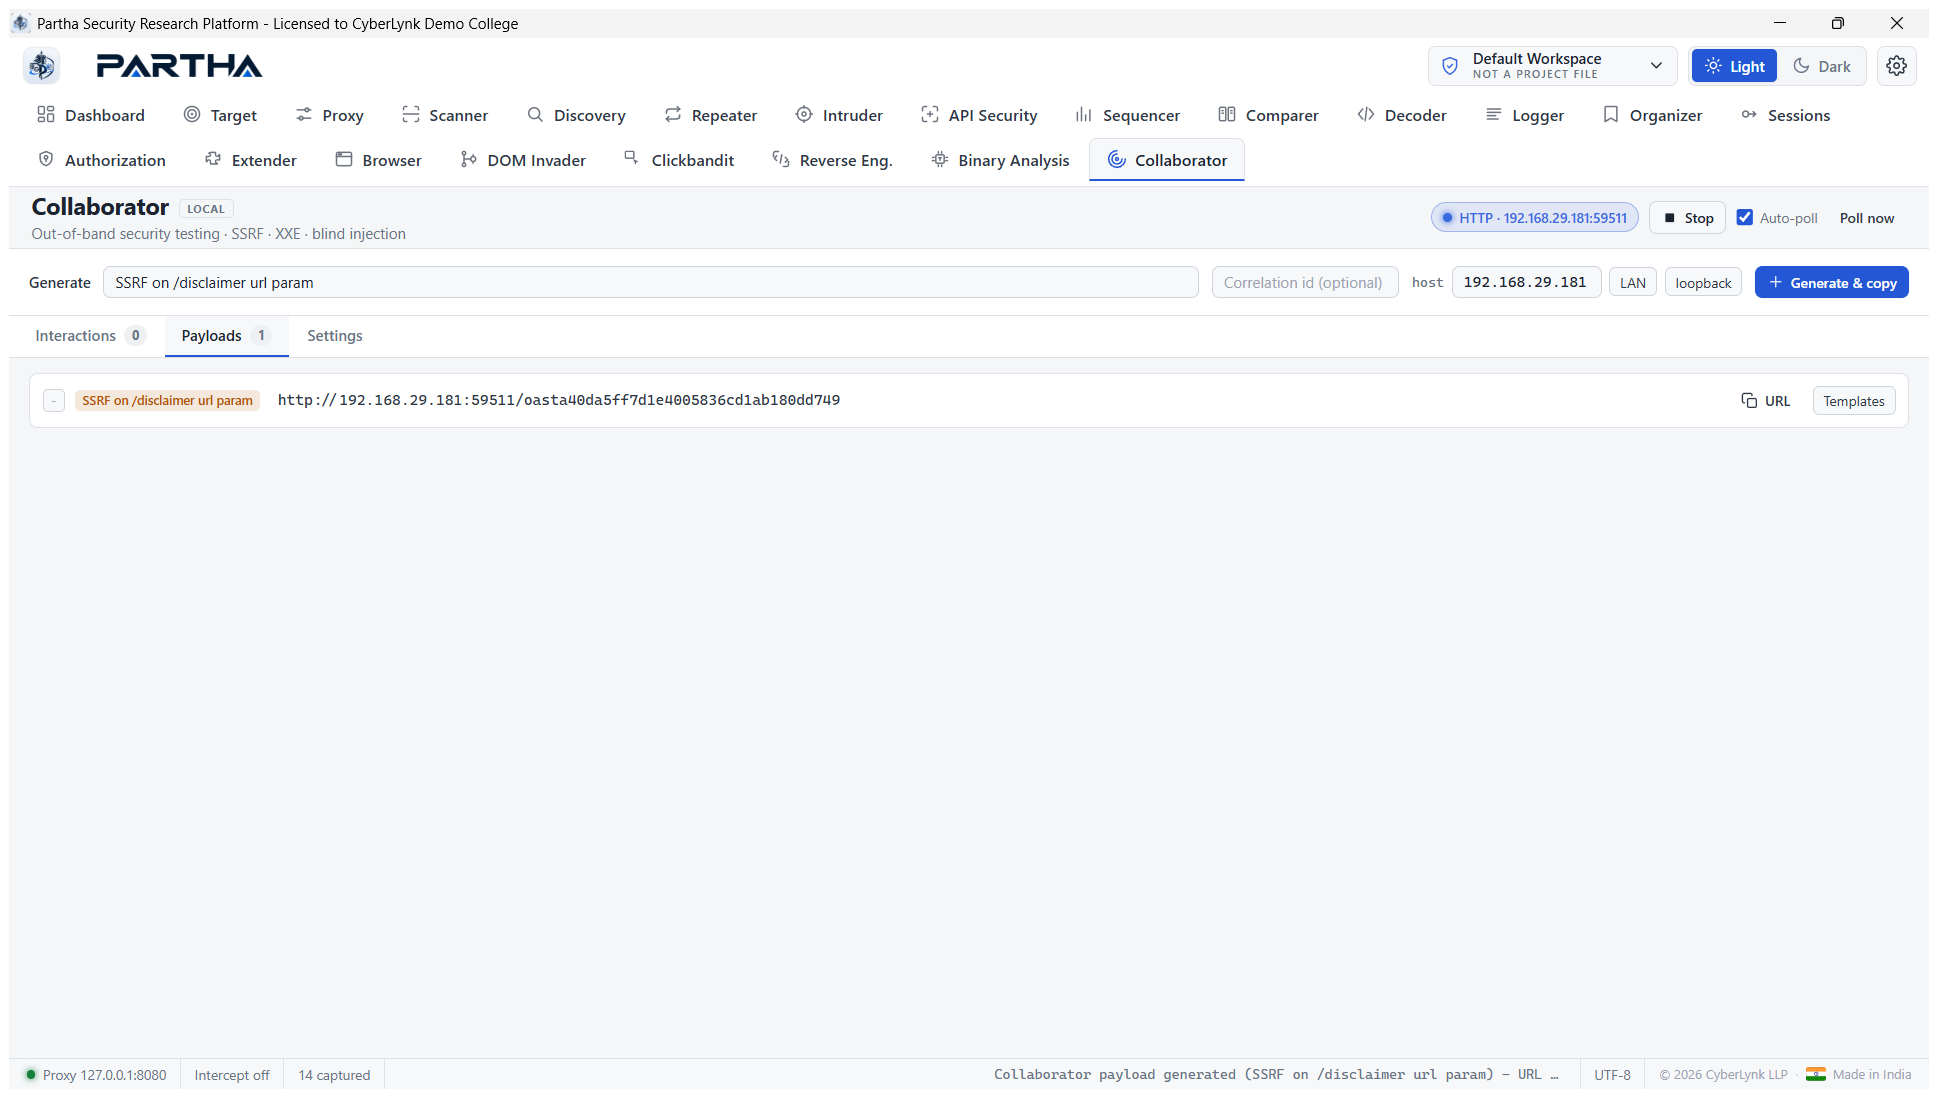
Generate a payload — with an optional note, mint a unique payload URL:
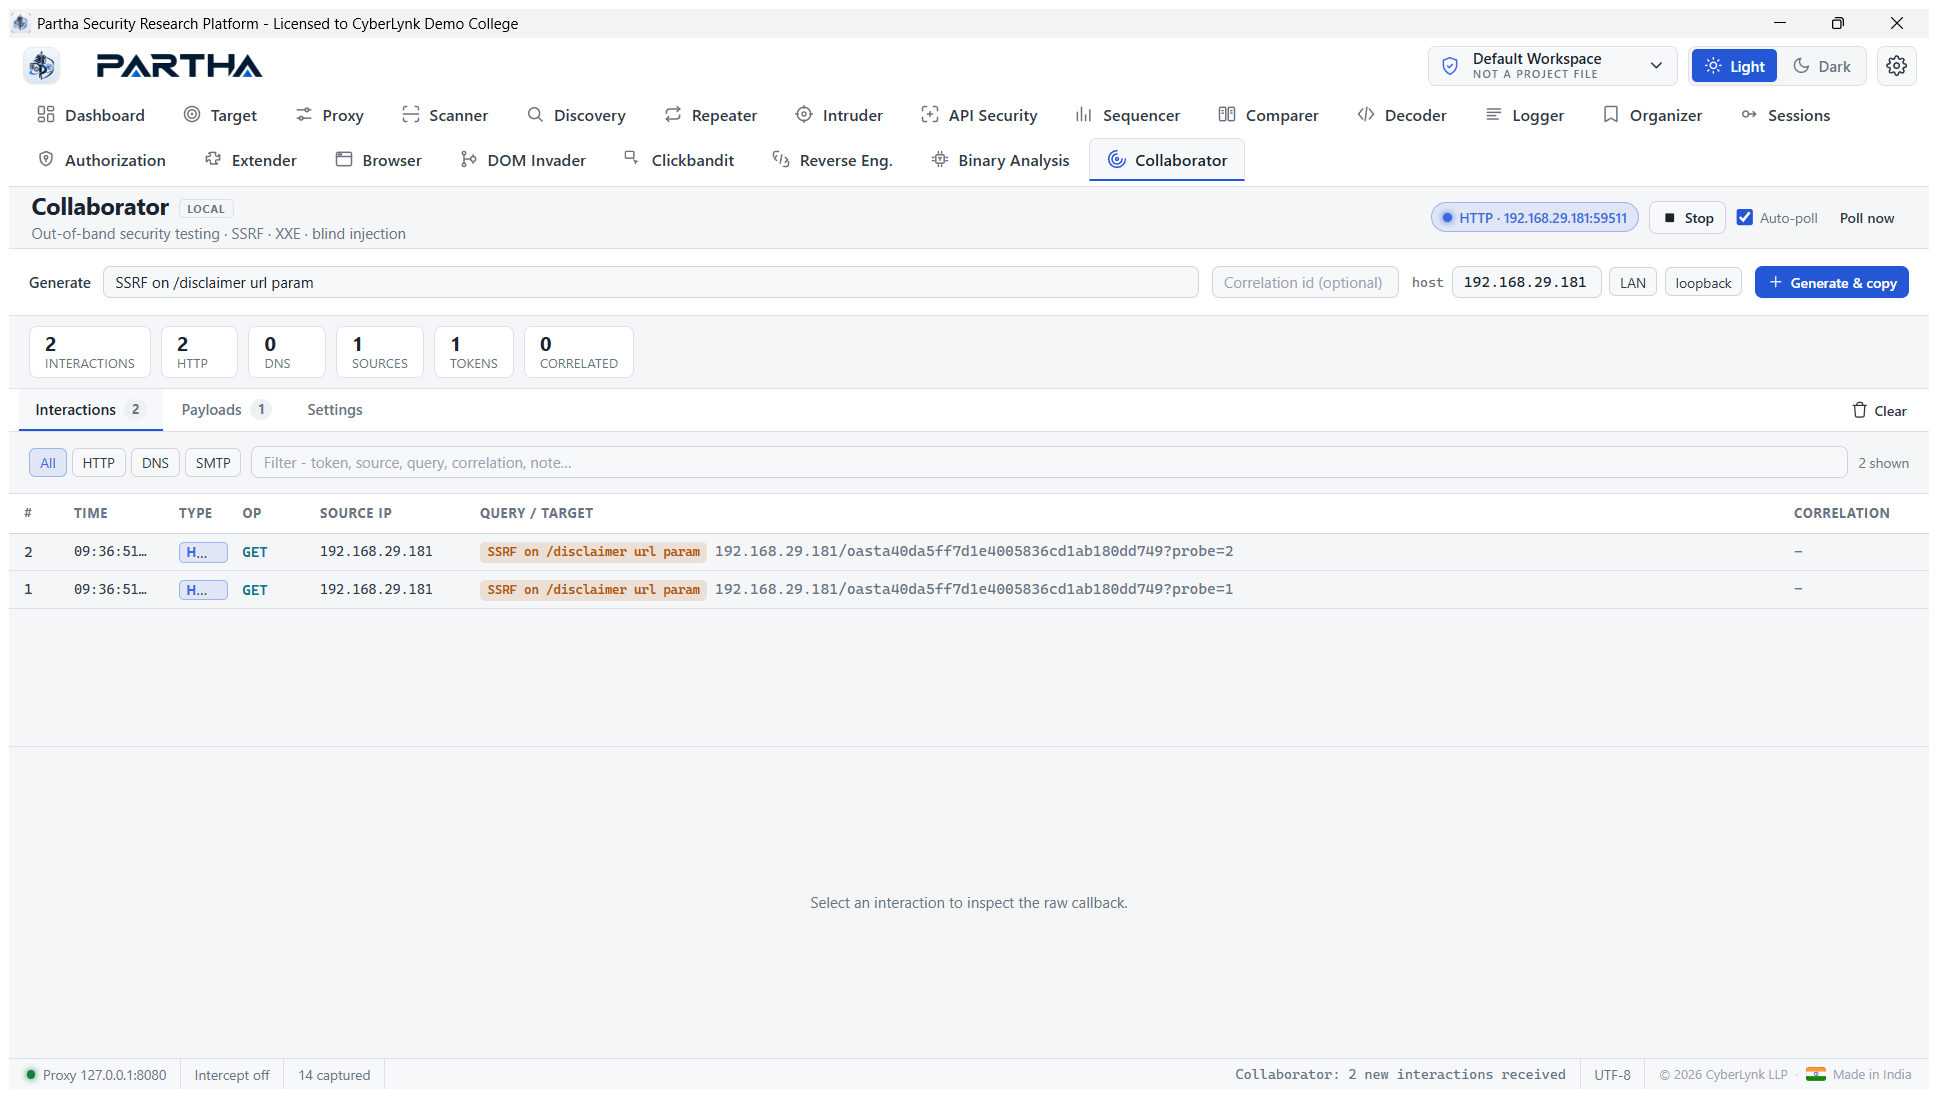
Trigger & correlate — after the payload was fetched, both callbacks landed in the Interactions table, correlated back to the payload's note ("SSRF on /disclaimer url param") with source IP, method and full target URL:
Steps: Generate & copy a payload → plant it in the target (a URL parameter, an XXE entity, a shell command, a hostname, …) → watch Interactions (auto-polled, filterable HTTP/DNS/SMTP). The Scanner's blind checks (SSRF, XXE, blind OS command injection) share this same listener, so scan-triggered callbacks surface here too.
6.23 Settings, licensing & project files#
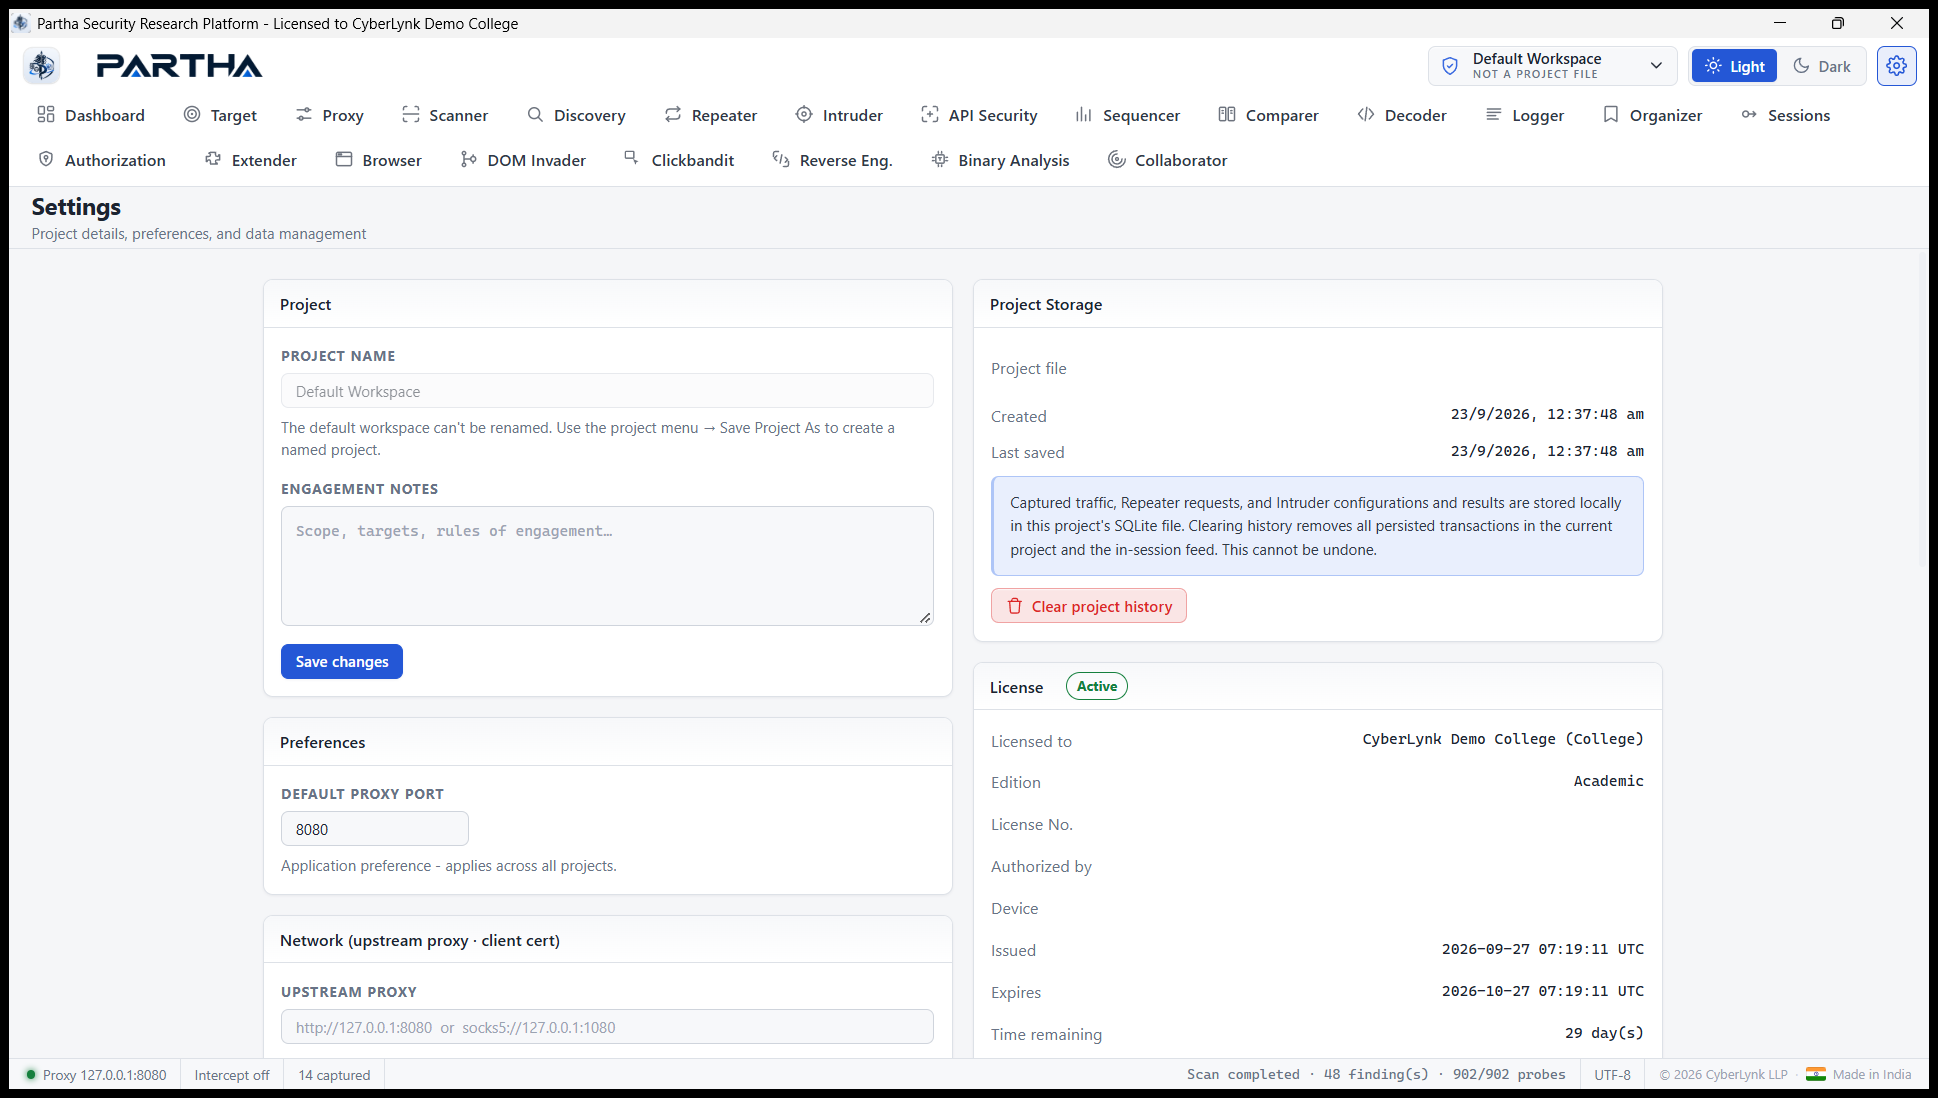
- Project — name and engagement notes.
- Project Storage — Partha keeps a persistent log of all testing activity
in project files: each project is a single self-contained
*.parthafile (proxy history, Repeater requests, Intruder configs/results, findings, annotations). New / Open / Save / Save As / Recent are in the workspace menu; there is always a default workspace. Clear project history wipes the current project. - Preferences — default proxy port.
- Network — upstream HTTP/SOCKS5 proxy, client TLS certificate (mutual TLS), proxy-bypass list; platform authentication (NTLM/Kerberos/Digest/Basic).
- License — the offline, device-bound license (here: CyberLynk Demo College, Academic edition, Active, with device ID and expiry).
Built-in and custom configurations recur throughout — the Scanner's built-in/custom scan configs, Extender packs, saved Repeater requests, and saved scope files are all reusable.
7. Cross-cutting UI#
These work everywhere in the app.
Command palette (Ctrl + K) — jump to any tool by name:
Right-click context menu — on any request row or message body: a full Send to list (Repeater, Intruder, Scanner, Sequencer, Comparer, Authorization, Organizer, Session macro, Decoder) plus Copy (URL / curl / request / response), row highlight colours, and Delete. The inspector panel opens alongside:
Light / Dark theme — toggle in the top-right identity bar (dark mode shown in §6.1).
8. Reporting#
Simple reporting with automated report generation. From the Scanner, use Export report to generate findings in HTML (print/PDF), Markdown, SARIF 2.1.0, JSON, CSV and XML. Each finding is rendered with its description, CWE/CVSS, escaped evidence, remediation and references, plus an executive summary with counts by severity. Individual CSRF PoC HTML is generated per finding from its advisory (§6.4).
Steps: Scanner → Export report → choose a format → save.
9. Appendix#
9.1 Keyboard & navigation#
Ctrl + K— command palette ·Ctrl + Enter— send in Repeater ·Ctrl + R/Ctrl + I— send to Repeater / Intruder from the context menu.- Right-click a request row or message body — full Send to… / Copy menu.
- Light/Dark theme toggle — top-right identity bar.
9.2 Safety & scope#
Partha intentionally relaxes upstream TLS verification so self-signed targets can be exercised, and its interception CA and testing-browser profile weaken browser security for authorized testing only. Never install the CA into trust stores you do not control, and only test systems you are authorized to assess.
Partha — Security Research Platform · © 2026 CyberLynk LLP. All rights reserved. Designed by CyberLynk LLP · Made in India